
- Home >
- Stock Photos >
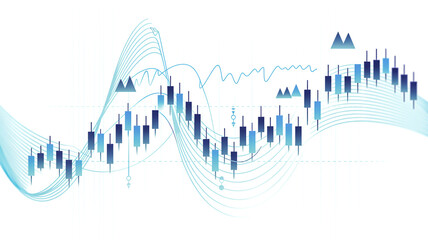
- Flowing Digital Data Wave with Grid on Gradient Background
Flowing Digital Data Wave with Grid on Gradient Background Image

This visual embodies modern financial data processing with a flowing digital wave line on a dynamic gradient background overlaying a grid pattern. It symbolizes data movements and analysis in the technology and finance sectors. Ideal for presentations on financial audits, business intelligence tools, or modern tech interfaces and integration processes.
Powered by 


downloads
Tags:
More
Credit Photo
If you would like to credit the Photo, here are some ways you can do so
Text Link
photo Link
<span class="text-link">
<span>
<a target="_blank" href=https://pikwizard.com/photo/flowing-digital-data-wave-with-grid-on-gradient-background/59674cd8a6a4558355a556edbfd7a73d/>PikWizard</a>
</span>
</span>
<span class="image-link">
<span
style="margin: 0 0 20px 0; display: inline-block; vertical-align: middle; width: 100%;"
>
<a
target="_blank"
href="https://pikwizard.com/photo/flowing-digital-data-wave-with-grid-on-gradient-background/59674cd8a6a4558355a556edbfd7a73d/"
style="text-decoration: none; font-size: 10px; margin: 0;"
>
<img src="https://pikwizard.com/pw/medium/59674cd8a6a4558355a556edbfd7a73d.jpg" style="margin: 0; width: 100%;" alt="" />
<p style="font-size: 12px; margin: 0;">PikWizard</p>
</a>
</span>
</span>
Free (free of charge)
Free for personal and commercial use.
Author: Awesome Content
Similar Free Stock Images

Premium


Premium

Premium


Premium


Premium


Premium


Premium


Premium


Premium

Premium

Premium

Premium


Premium


Premium


Premium

Premium


Premium


Premium


Premium


Premium


Premium


Premium


Premium


Premium
Premium


Explore More Free Stock Images