
- Home >
- Stock Photos >
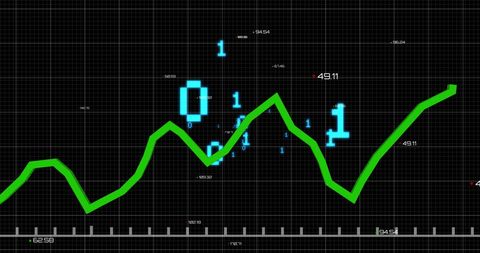
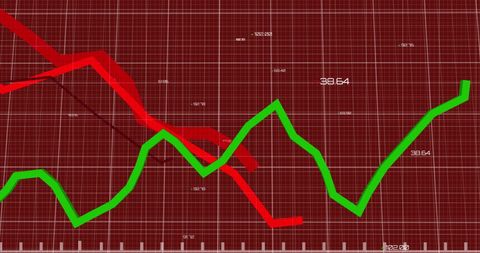
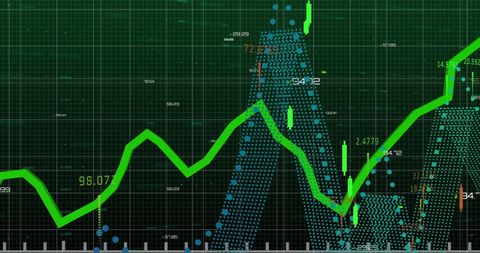
- Fluctuating Financial Data with Graph Overlay
Fluctuating Financial Data with Graph Overlay Image

Fluctuating green line along a grid overlay signifying market trends, with a contrasting red area graph below indicating negative performance. Ideal for use in financial essays, analytics blogs, technology articles, or digital finance seminars, emphasizing market fluctuation or financial analysis themes.
Powered by 


downloads
Tags:
More
Credit Photo
If you would like to credit the Photo, here are some ways you can do so
Text Link
photo Link
<span class="text-link">
<span>
<a target="_blank" href=https://pikwizard.com/photo/fluctuating-financial-data-with-graph-overlay/18fb5b85f68f8e6fc4ffb8097817af43/>PikWizard</a>
</span>
</span>
<span class="image-link">
<span
style="margin: 0 0 20px 0; display: inline-block; vertical-align: middle; width: 100%;"
>
<a
target="_blank"
href="https://pikwizard.com/photo/fluctuating-financial-data-with-graph-overlay/18fb5b85f68f8e6fc4ffb8097817af43/"
style="text-decoration: none; font-size: 10px; margin: 0;"
>
<img src="https://pikwizard.com/pw/medium/18fb5b85f68f8e6fc4ffb8097817af43.jpg" style="margin: 0; width: 100%;" alt="" />
<p style="font-size: 12px; margin: 0;">PikWizard</p>
</a>
</span>
</span>
Free (free of charge)
Free for personal and commercial use.
Author: Awesome Content
Similar Free Stock Images

Premium


Premium


Premium


Premium


Premium

Premium


Premium


Premium

Premium


Premium


Premium


Premium

Premium


Premium

Premium


Premium


Premium


Premium


Premium


Premium


Premium


Premium


Premium


Premium


Premium

Explore More Free Stock Images