- Home >
- Stock Photos >
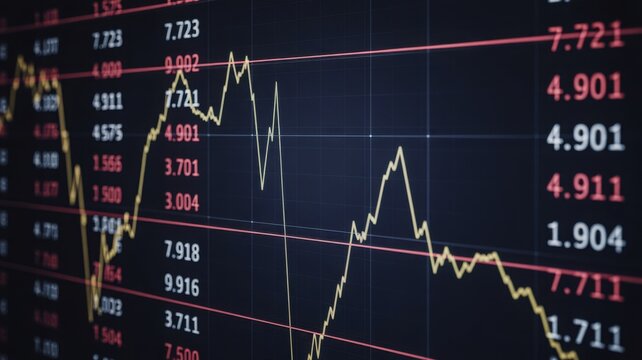
- Fluctuating Financial Graph on Digital Orange Background
Fluctuating Financial Graph on Digital Orange Background Image

This design illustrates a fluctuating financial graph on a digital orange background, embodying concepts in data analysis and market trends. Used frequently in illustrating economics, business presentations, stock market reports, or digital-influenced financial forecasts. Also fits well in articles discussing industry trends or financial technology support.
Powered by 


downloads
Tags:
More
Credit Photo
If you would like to credit the Photo, here are some ways you can do so
Text Link
photo Link
<span class="text-link">
<span>
<a target="_blank" href=https://pikwizard.com/photo/fluctuating-financial-graph-on-digital-orange-background/14582393fd14ddad6fb135abcf6d07b7/>PikWizard</a>
</span>
</span>
<span class="image-link">
<span
style="margin: 0 0 20px 0; display: inline-block; vertical-align: middle; width: 100%;"
>
<a
target="_blank"
href="https://pikwizard.com/photo/fluctuating-financial-graph-on-digital-orange-background/14582393fd14ddad6fb135abcf6d07b7/"
style="text-decoration: none; font-size: 10px; margin: 0;"
>
<img src="https://pikwizard.com/pw/medium/14582393fd14ddad6fb135abcf6d07b7.jpg" style="margin: 0; width: 100%;" alt="" />
<p style="font-size: 12px; margin: 0;">PikWizard</p>
</a>
</span>
</span>
Free (free of charge)
Free for personal and commercial use.
Author: Authentic Images
Similar Free Stock Images
Loading...

Premium


Premium

Premium


Premium


Premium

Premium


Premium


Premium
Premium

Premium

Premium


Premium


Premium


Premium


Premium


Premium


Premium


Premium


Premium


Premium

Premium

Premium


Premium


Premium


Premium