- Home >
- Stock Photos >
- Fluctuating Stock Market Trends on Digital Financial Graph
Fluctuating Stock Market Trends on Digital Financial Graph Image
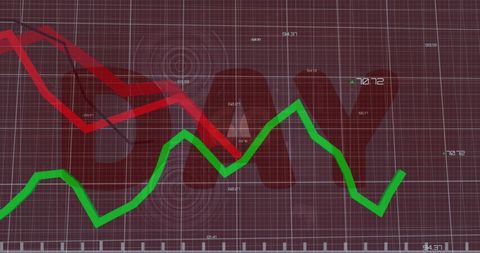
Illustrates volatile stock market conditions with red and green lines indicating decline and growth. Useful for presentations on financial analysis, investment strategies, economic reports, trading algorithms, and market studies.
Powered by  - Get 15% off with code: PIKWIZARD15


2
downloads
downloads
Tags:
More
Credit Photo
If you would like to credit the Photo, here are some ways you can do so
Text Link
photo Link
<span class="text-link">
<span>
<a target="_blank" href=https://pikwizard.com/photo/fluctuating-stock-market-trends-on-digital-financial-graph/bc71dcbf943aec80f567f870f7939e1a/>PikWizard</a>
</span>
</span>
<span class="image-link">
<span
style="margin: 0 0 20px 0; display: inline-block; vertical-align: middle; width: 100%;"
>
<a
target="_blank"
href="https://pikwizard.com/photo/fluctuating-stock-market-trends-on-digital-financial-graph/bc71dcbf943aec80f567f870f7939e1a/"
style="text-decoration: none; font-size: 10px; margin: 0;"
>
<img src="https://pikwizard.com/pw/medium/bc71dcbf943aec80f567f870f7939e1a.jpg" style="margin: 0; width: 100%;" alt="" />
<p style="font-size: 12px; margin: 0;">PikWizard</p>
</a>
</span>
</span>
Free (free of charge)
Free for personal and commercial use.
Author: Creative Art
Similar Free Stock Images
Loading...

Premium


Premium


Premium


Premium


Premium


Premium

Premium


Premium


Premium


Premium

Premium


Premium


Premium

Premium


Premium


Premium


Premium


Premium


Premium


Premium

Premium


Premium


Premium


Premium


Premium