
- Home >
- Stock Photos >
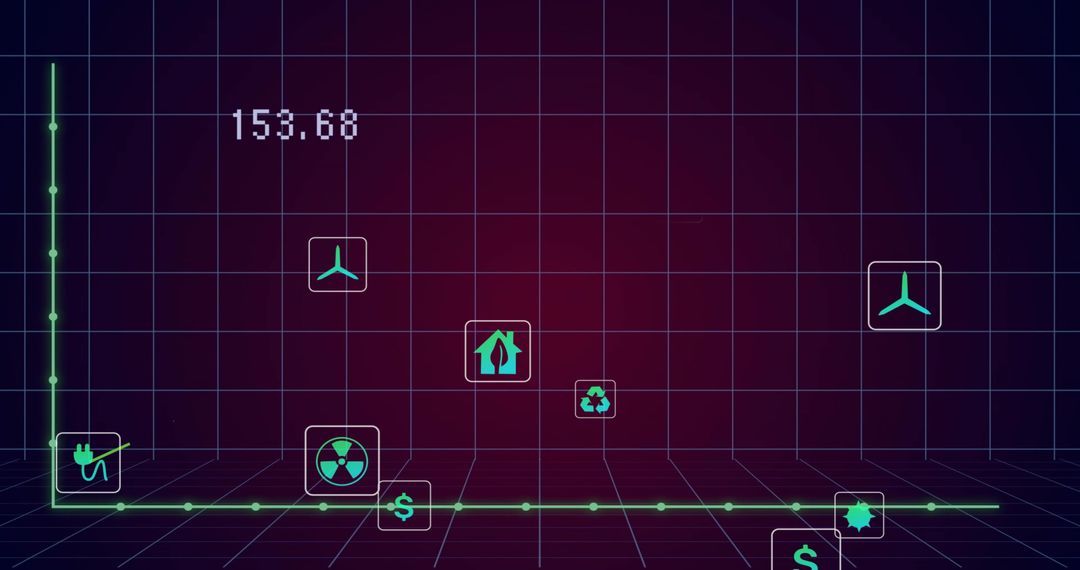
- Futuristic 3D analytics dashboard displaying rising green line chart with social callouts
Futuristic 3D analytics dashboard displaying rising green line chart with social callouts Image
Dark futuristic 3D grid featuring rising neon green line chart with nodes, numeric callouts, and social engagement icons. Suiting representation of data trends, KPI dashboards, social media analytics, fintech metrics, business intelligence, market performance. Ideal for website hero banners, pitch decks, annual reports, blog headers, marketing campaigns, training materials, UI mockups, presentation backgrounds. Allowing customization with company logo, overlays, annotations, or color adjustments to match brand. High-contrast composition supporting clear legibility on screen and print.
Powered by  - Get 15% off with code: PIKWIZARD15


0
downloads
downloads
Tags:
More
Credit Photo
If you would like to credit the Photo, here are some ways you can do so
Text Link
photo Link
<span class="text-link">
<span>
<a target="_blank" href=https://pikwizard.com/photo/futuristic-3d-analytics-dashboard-displaying-rising-green-line-chart-with-social-callouts/4736bbd98093c2d02dbcdc6476dc4450/>PikWizard</a>
</span>
</span>
<span class="image-link">
<span
style="margin: 0 0 20px 0; display: inline-block; vertical-align: middle; width: 100%;"
>
<a
target="_blank"
href="https://pikwizard.com/photo/futuristic-3d-analytics-dashboard-displaying-rising-green-line-chart-with-social-callouts/4736bbd98093c2d02dbcdc6476dc4450/"
style="text-decoration: none; font-size: 10px; margin: 0;"
>
<img src="https://pikwizard.com/pw/medium/4736bbd98093c2d02dbcdc6476dc4450.jpg" style="margin: 0; width: 100%;" alt="" />
<p style="font-size: 12px; margin: 0;">PikWizard</p>
</a>
</span>
</span>
Free (free of charge)
Free for personal and commercial use.
Author: Awesome Content
Similar Free Stock Images

Premium


Premium


Premium


Premium


Premium


Premium


Premium


Premium


Premium


Premium


Premium


Premium


Premium


Premium


Premium


Premium


Premium


Premium


Premium


Premium


Premium


Premium


Premium


Premium

