- Home >
- Stock Photos >
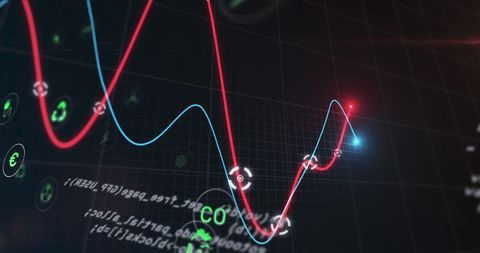
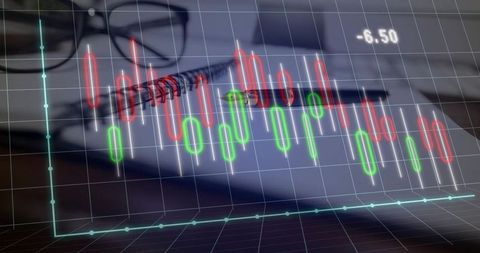
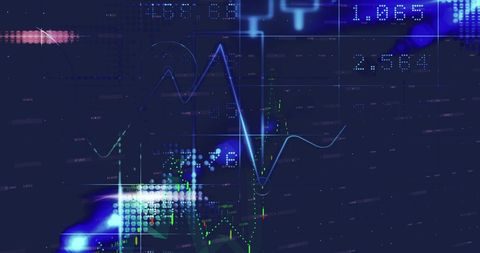
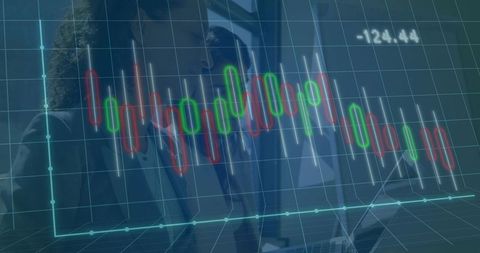
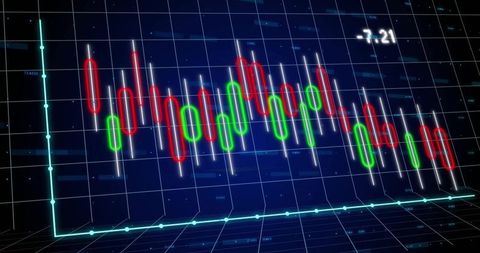
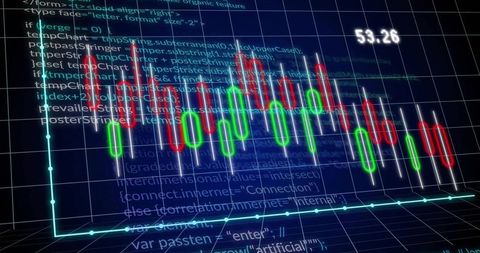
- Futuristic 3D Candlestick Chart with Red and Green Bars
Futuristic 3D Candlestick Chart with Red and Green Bars Image
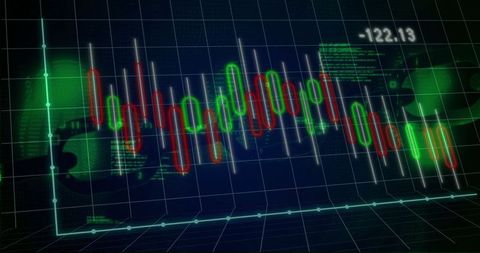
Captivating visualization of financial trends with red and green candlestick bars moving dynamically on a 3D grid background. Ideal for illustrating financial articles, investment presentations, data analytics tools, or technology-driven finance discussions, this image evokes a high-tech, forward-thinking perspective in modern finance.
Powered by  - Get 15% off with code: PIKWIZARD15


2
downloads
downloads
Tags:
More
Credit Photo
If you would like to credit the Photo, here are some ways you can do so
Text Link
photo Link
<span class="text-link">
<span>
<a target="_blank" href=https://pikwizard.com/photo/futuristic-3d-candlestick-chart-with-red-and-green-bars/e0c77d799db6d84e365920827e8d2879/>PikWizard</a>
</span>
</span>
<span class="image-link">
<span
style="margin: 0 0 20px 0; display: inline-block; vertical-align: middle; width: 100%;"
>
<a
target="_blank"
href="https://pikwizard.com/photo/futuristic-3d-candlestick-chart-with-red-and-green-bars/e0c77d799db6d84e365920827e8d2879/"
style="text-decoration: none; font-size: 10px; margin: 0;"
>
<img src="https://pikwizard.com/pw/medium/e0c77d799db6d84e365920827e8d2879.jpg" style="margin: 0; width: 100%;" alt="" />
<p style="font-size: 12px; margin: 0;">PikWizard</p>
</a>
</span>
</span>
Free (free of charge)
Free for personal and commercial use.
Author: Awesome Content