
- Home >
- Stock Photos >
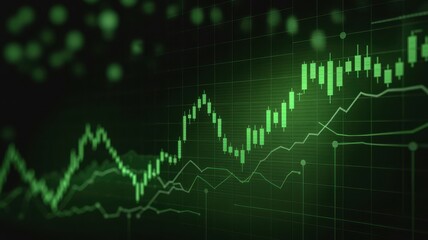
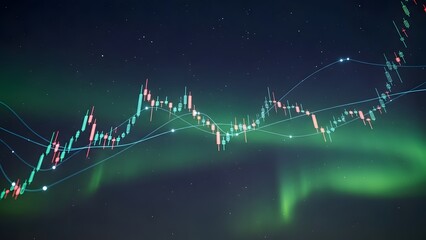
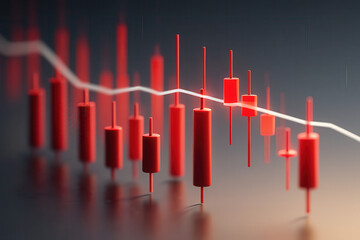
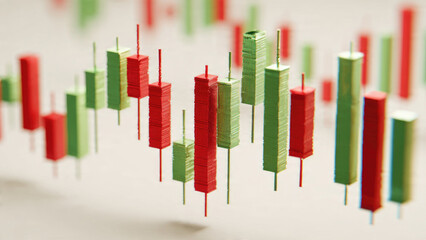
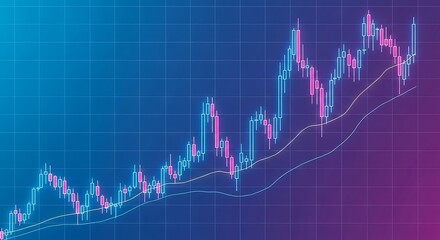
- Futuristic Candlestick Chart on Blue Grid Background
Futuristic Candlestick Chart on Blue Grid Background Image

Blue grid shows candlestick chart bars, representing financial trends digital analytics. Ideal for financial tech articles, investment presentations, or digital media projects focusing on market trends or financial data visualization.
Powered by 


downloads
Tags:
More
Credit Photo
If you would like to credit the Photo, here are some ways you can do so
Text Link
photo Link
<span class="text-link">
<span>
<a target="_blank" href=https://pikwizard.com/photo/futuristic-candlestick-chart-on-blue-grid-background/46cab2e7701ff5a2819b45496cbcea7a/>PikWizard</a>
</span>
</span>
<span class="image-link">
<span
style="margin: 0 0 20px 0; display: inline-block; vertical-align: middle; width: 100%;"
>
<a
target="_blank"
href="https://pikwizard.com/photo/futuristic-candlestick-chart-on-blue-grid-background/46cab2e7701ff5a2819b45496cbcea7a/"
style="text-decoration: none; font-size: 10px; margin: 0;"
>
<img src="https://pikwizard.com/pw/medium/46cab2e7701ff5a2819b45496cbcea7a.jpg" style="margin: 0; width: 100%;" alt="" />
<p style="font-size: 12px; margin: 0;">PikWizard</p>
</a>
</span>
</span>
Free (free of charge)
Free for personal and commercial use.
Author: People Creations
Similar Free Stock Images

Premium


Premium


Premium


Premium
Premium


Premium


Premium

Premium


Premium
Premium


Premium


Premium
Premium


Premium


Premium


Premium
Premium
Premium
Premium

AI


Premium


Premium

Premium


Premium


Premium


Premium


Explore More Free Stock Images