
- Home >
- Free Stock Photos & Images >
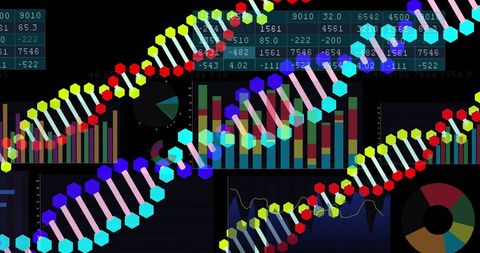
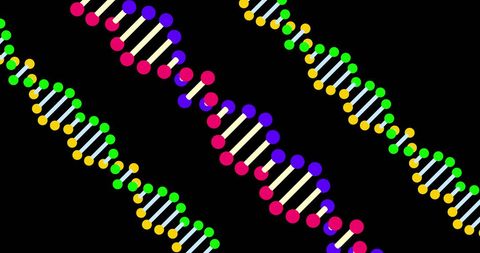
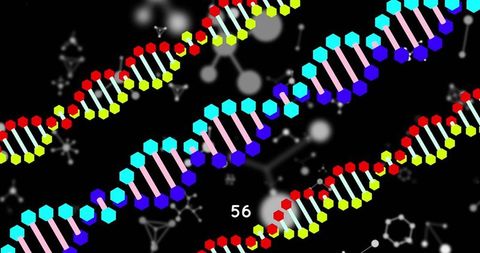
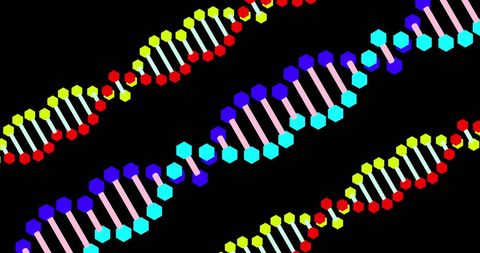
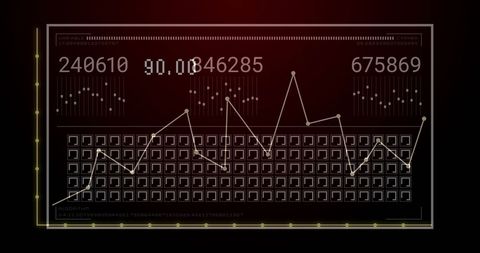
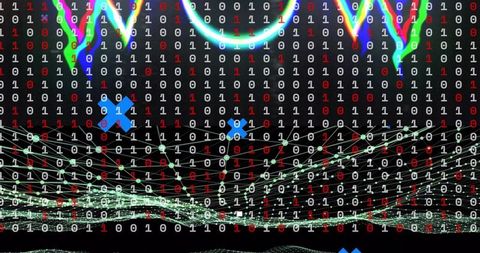
- Futuristic dashboard displaying numeric counters, DNA helix overlay and grid interface
Futuristic dashboard displaying numeric counters, DNA helix overlay and grid interface Free Stock Image
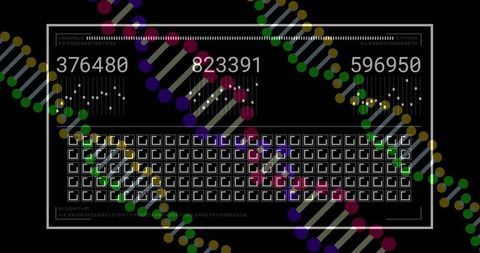
High-contrast futuristic dashboard featuring three numeric counters, grid of square nodes and overlapping DNA helix motifs in neon colors on black background. Suiting technology and biotech projects, showcasing data-driven design for presentations, website hero banners, app UI mockups and editorial spreads about genomics and data analysis. Working well for animated intros, motion graphics overlays and infographic panels; layered elements allowing color adjustment and selective highlighting to match brand palette. Recommending cropping for wide banners and isolating counter area for iconography; pairing with clean sans-serif typography to amplify modern tech vibe.
Powered by  - Get 15% off with code: PIKWIZARD15


downloads
Tags:
More
Credit Photo
If you would like to credit the Photo, here are some ways you can do so
Text Link
photo Link
<span class="text-link">
<span>
<a target="_blank" href=https://pikwizard.com/photo/futuristic-dashboard-displaying-numeric-counters-dna-helix-overlay-and-grid-interface/868feccb837ce42150f293508359e9db/>PikWizard</a>
</span>
</span>
<span class="image-link">
<span
style="margin: 0 0 20px 0; display: inline-block; vertical-align: middle; width: 100%;"
>
<a
target="_blank"
href="https://pikwizard.com/photo/futuristic-dashboard-displaying-numeric-counters-dna-helix-overlay-and-grid-interface/868feccb837ce42150f293508359e9db/"
style="text-decoration: none; font-size: 10px; margin: 0;"
>
<img src="https://thumbs.wbm.im/pw/medium/868feccb837ce42150f293508359e9db.jpg" style="margin: 0; width: 100%;" alt="Futuristic dashboard displaying numeric counters, DNA helix overlay and grid interface" />
<p style="font-size: 12px; margin: 0;">PikWizard</p>
</a>
</span>
</span>
Free (free of charge)
Free for personal and commercial use.
Author: Authentic Images
Similar Free Stock Images


Premium


Premium


Premium


Premium


Premium


Premium


Premium


Premium


Premium


Premium


Premium


Premium


Premium


Premium


Premium


Premium

Premium


Premium


Premium


Premium


Premium


Premium


Premium


Premium


Premium

Explore More Free Stock Images