- Home >
- Stock Photos >
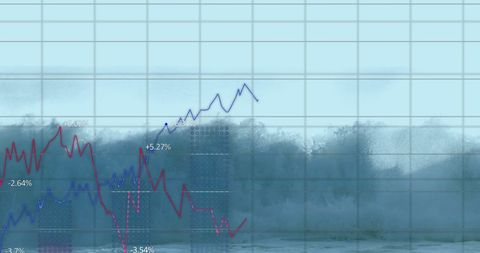
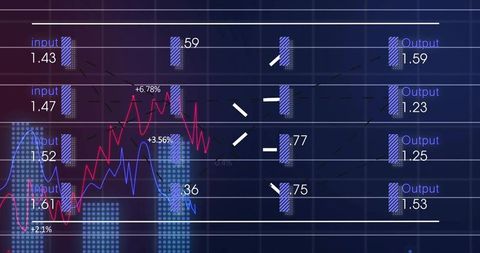
- Futuristic Data Analysis and Statistical Interface Visualization
Futuristic Data Analysis and Statistical Interface Visualization Image

Abstract illustration combines dynamic shifting numbers with vibrant digital graphs and neon scanners. Perfect for depicting modern technological advances in statistics, data analytics, and business solutions. Ideal for tech presentations, innovation articles, or financial news updates.

downloads
Tags:
More
Credit Photo
If you would like to credit the Photo, here are some ways you can do so
Text Link
photo Link
<span class="text-link">
<span>
<a target="_blank" href=https://pikwizard.com/photo/futuristic-data-analysis-and-statistical-interface-visualization/ec2b5ad000cf99ee0fc44eccd2f42f56/>PikWizard</a>
</span>
</span>
<span class="image-link">
<span
style="margin: 0 0 20px 0; display: inline-block; vertical-align: middle; width: 100%;"
>
<a
target="_blank"
href="https://pikwizard.com/photo/futuristic-data-analysis-and-statistical-interface-visualization/ec2b5ad000cf99ee0fc44eccd2f42f56/"
style="text-decoration: none; font-size: 10px; margin: 0;"
>
<img src="https://pikwizard.com/pw/medium/ec2b5ad000cf99ee0fc44eccd2f42f56.jpg" style="margin: 0; width: 100%;" alt="" />
<p style="font-size: 12px; margin: 0;">PikWizard</p>
</a>
</span>
</span>
Free (free of charge)
Free for personal and commercial use.
Author: Awesome Content