
- Home >
- Stock Photos >
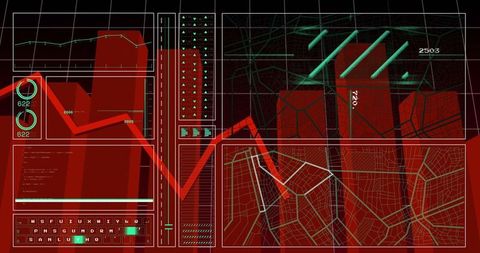
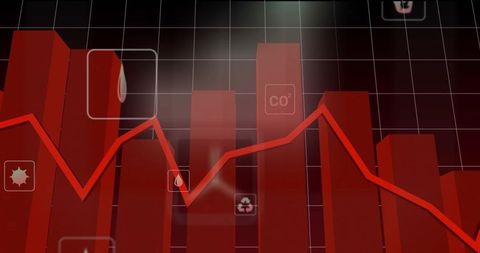
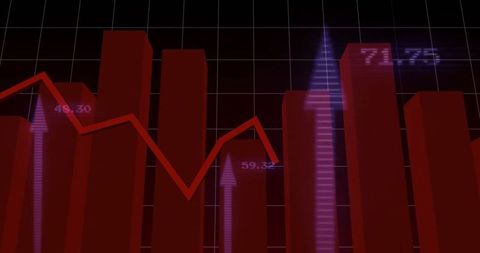
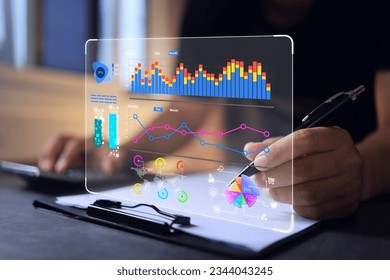
- Futuristic Data Analysis with Digital Red Graph and HUD Interface
Futuristic Data Analysis with Digital Red Graph and HUD Interface Image
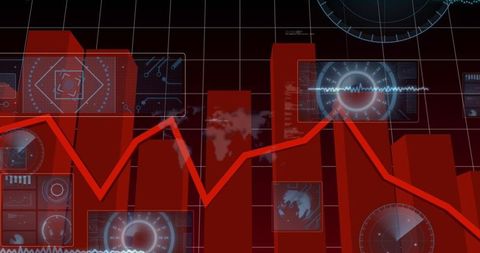
The digital red graph overlayed upon high-tech screens suggests advanced data analysis in a futuristic business setting. Ideal for illustrating concepts of financial trends, business strategy, global connections, and technological innovation in corporate environments. Useful in business presentations, fiscal reports, or publications on economic forecasts and technology-driven markets.
Powered by  - Get 15% off with code: PIKWIZARD15


downloads
Tags:
More
Credit Photo
If you would like to credit the Photo, here are some ways you can do so
Text Link
photo Link
<span class="text-link">
<span>
<a target="_blank" href=https://pikwizard.com/photo/futuristic-data-analysis-with-digital-red-graph-and-hud-interface/a4c181f150b5d5b19cb28bee99f36485/>PikWizard</a>
</span>
</span>
<span class="image-link">
<span
style="margin: 0 0 20px 0; display: inline-block; vertical-align: middle; width: 100%;"
>
<a
target="_blank"
href="https://pikwizard.com/photo/futuristic-data-analysis-with-digital-red-graph-and-hud-interface/a4c181f150b5d5b19cb28bee99f36485/"
style="text-decoration: none; font-size: 10px; margin: 0;"
>
<img src="https://pikwizard.com/pw/medium/a4c181f150b5d5b19cb28bee99f36485.jpg" style="margin: 0; width: 100%;" alt="" />
<p style="font-size: 12px; margin: 0;">PikWizard</p>
</a>
</span>
</span>
Free (free of charge)
Free for personal and commercial use.
Author: Awesome Content
Similar Free Stock Images

Premium


Premium


Premium


Premium

Premium


Premium


Premium


Premium


Premium


Premium
Premium


Premium


Premium


Premium

Premium


Premium


Premium


Premium


Premium


Premium


Premium


Premium


Premium


Premium


Premium


Explore More Free Stock Images