
- Home >
- Stock Photos >
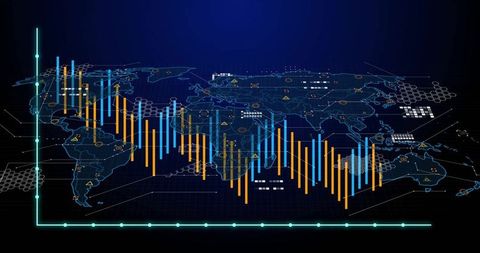
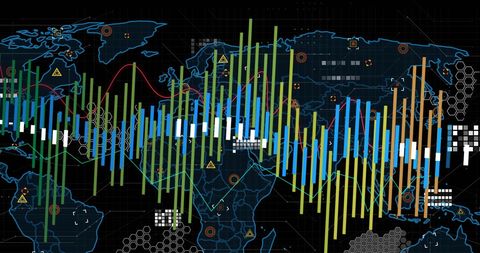
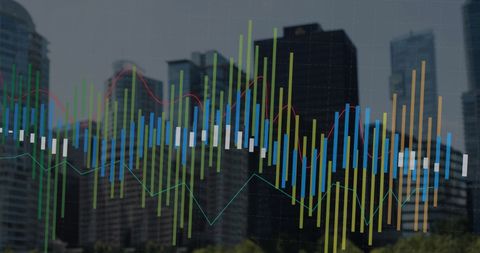
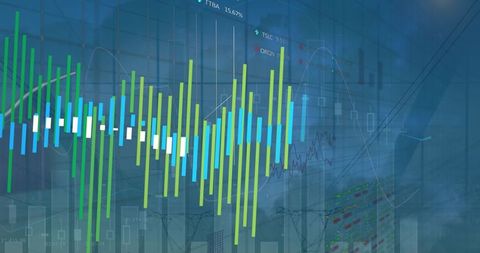
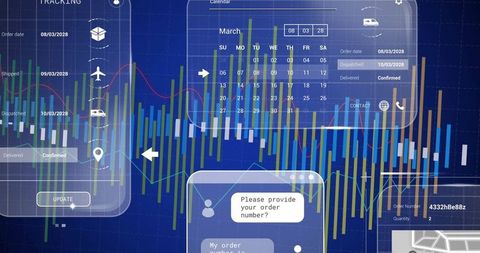
- Futuristic Data Analytics and Digital Visualization on Technology Screen
Futuristic Data Analytics and Digital Visualization on Technology Screen Image

Illustration depicts a high-tech interface displaying analytical graphs, showcasing cutting-edge data visualization and technology. Map of the world and circuitry elements imply precision and connectivity. Ideal for use in themes related to technological advancements, business intelligence, big data analytics, and digital dashboards in promotional, marketing, and educational materials.
Powered by  - Get 15% off with code: PIKWIZARD15


downloads
Tags:
More
Credit Photo
If you would like to credit the Photo, here are some ways you can do so
Text Link
photo Link
<span class="text-link">
<span>
<a target="_blank" href=https://pikwizard.com/photo/futuristic-data-analytics-and-digital-visualization-on-technology-screen/e7887dd5bb579fdfef8ff68a2a878b4b/>PikWizard</a>
</span>
</span>
<span class="image-link">
<span
style="margin: 0 0 20px 0; display: inline-block; vertical-align: middle; width: 100%;"
>
<a
target="_blank"
href="https://pikwizard.com/photo/futuristic-data-analytics-and-digital-visualization-on-technology-screen/e7887dd5bb579fdfef8ff68a2a878b4b/"
style="text-decoration: none; font-size: 10px; margin: 0;"
>
<img src="https://pikwizard.com/pw/medium/e7887dd5bb579fdfef8ff68a2a878b4b.jpg" style="margin: 0; width: 100%;" alt="" />
<p style="font-size: 12px; margin: 0;">PikWizard</p>
</a>
</span>
</span>
Free (free of charge)
Free for personal and commercial use.
Author: Creative Art
Similar Free Stock Images

Premium


Premium


Premium


Premium


Premium


Premium


Premium


Premium


Premium


Premium


Premium

Premium


Premium

Premium


Premium


Premium

Premium

Premium


Premium

Premium


Premium

Premium


Premium


Premium


Premium


Explore More Free Stock Images