
- Home >
- Stock Photos >
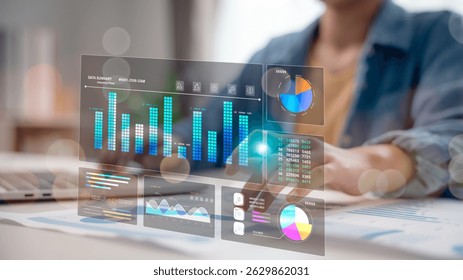
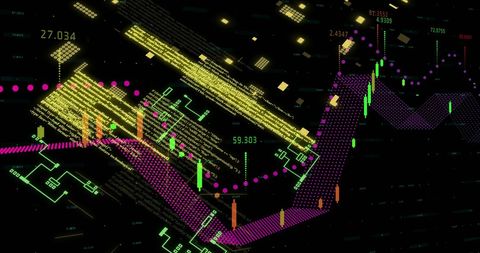
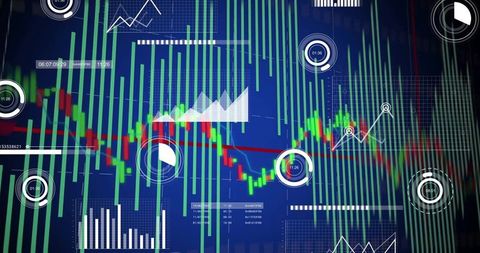
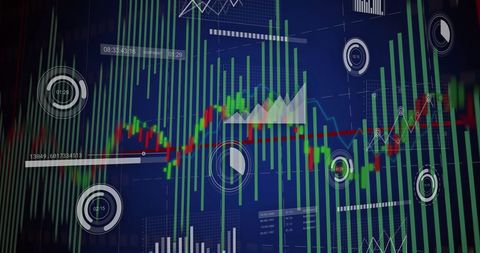
- Futuristic Data Analytics Dashboard with Graphs and Code
Futuristic Data Analytics Dashboard with Graphs and Code Image

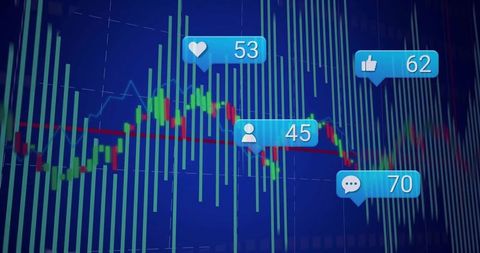
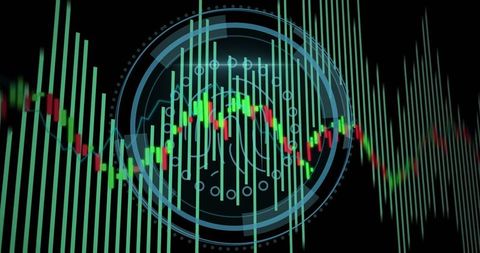
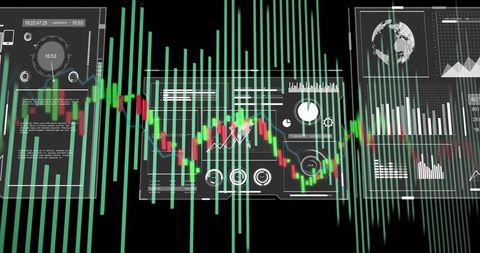
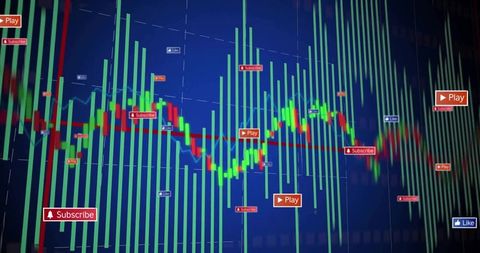
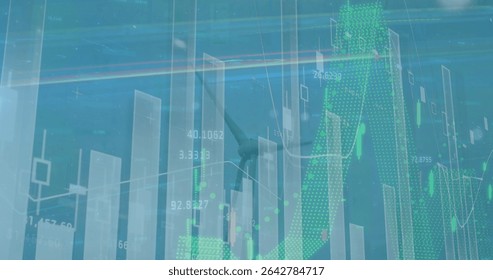
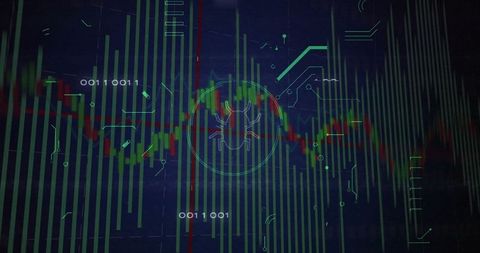
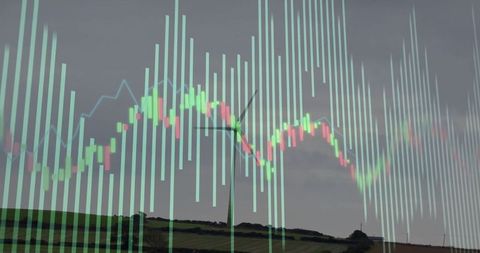
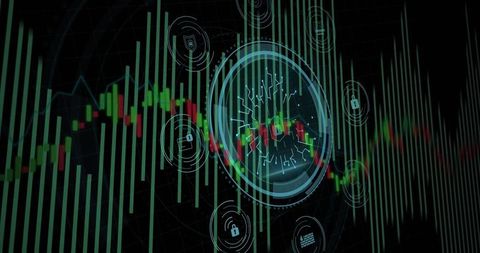
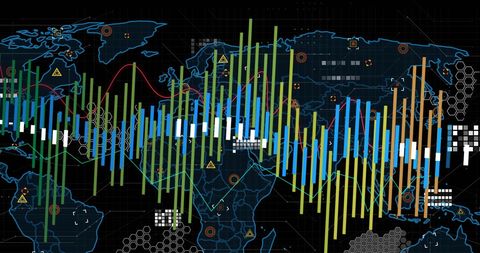
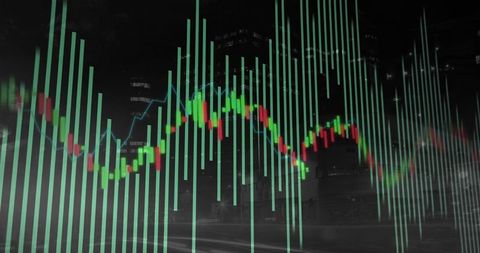
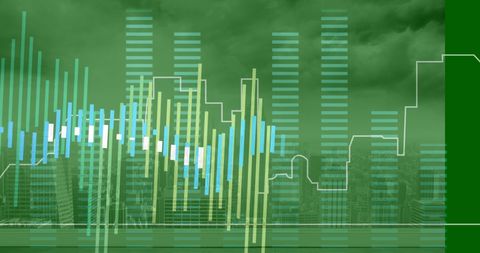
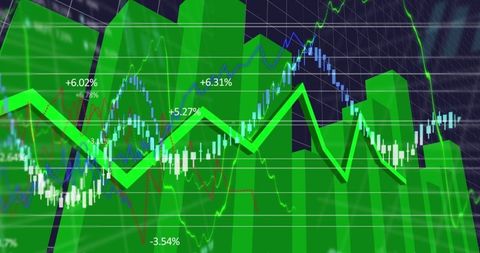
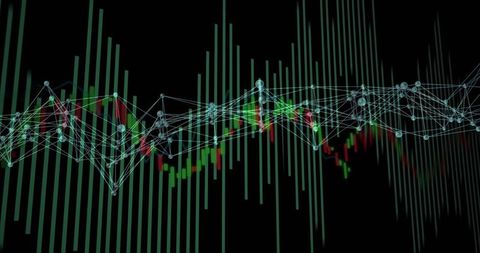
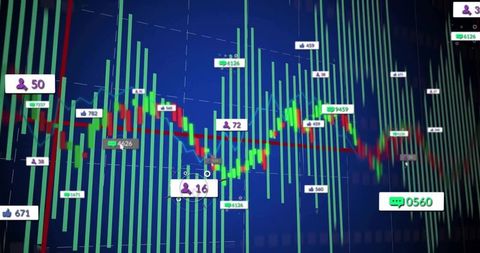
This visual showcases a sophisticated digital dashboard featuring dynamic bar and candlestick charts in conjunction with code snippets and abstract hex icons symbolizing analytics and technology. It emphasizes the integration of data visualization with innovative technologies. This design is ideal for use in presentations, reports, or digital forums that discuss advancements in data analytics, coding interfaces, and digital productivity solutions.
Powered by  - Get 15% off with code: PIKWIZARD15


downloads
Tags:
More
Credit Photo
If you would like to credit the Photo, here are some ways you can do so
Text Link
photo Link
<span class="text-link">
<span>
<a target="_blank" href=https://pikwizard.com/photo/futuristic-data-analytics-dashboard-with-graphs-and-code/ac80aac71dd71311ae41f12da5b5c44c/>PikWizard</a>
</span>
</span>
<span class="image-link">
<span
style="margin: 0 0 20px 0; display: inline-block; vertical-align: middle; width: 100%;"
>
<a
target="_blank"
href="https://pikwizard.com/photo/futuristic-data-analytics-dashboard-with-graphs-and-code/ac80aac71dd71311ae41f12da5b5c44c/"
style="text-decoration: none; font-size: 10px; margin: 0;"
>
<img src="https://pikwizard.com/pw/medium/ac80aac71dd71311ae41f12da5b5c44c.jpg" style="margin: 0; width: 100%;" alt="" />
<p style="font-size: 12px; margin: 0;">PikWizard</p>
</a>
</span>
</span>
Free (free of charge)
Free for personal and commercial use.
Author: Creative Art
Similar Free Stock Images
Premium


Premium

Premium


Premium


Premium


Premium


Premium


Premium

Premium


Premium


Premium


Premium


Premium


Premium


Premium

Premium


Premium


Premium

Premium


Premium

Premium


Premium


Premium


Premium


Premium


Explore More Free Stock Images