- Home >
- Stock Photos >
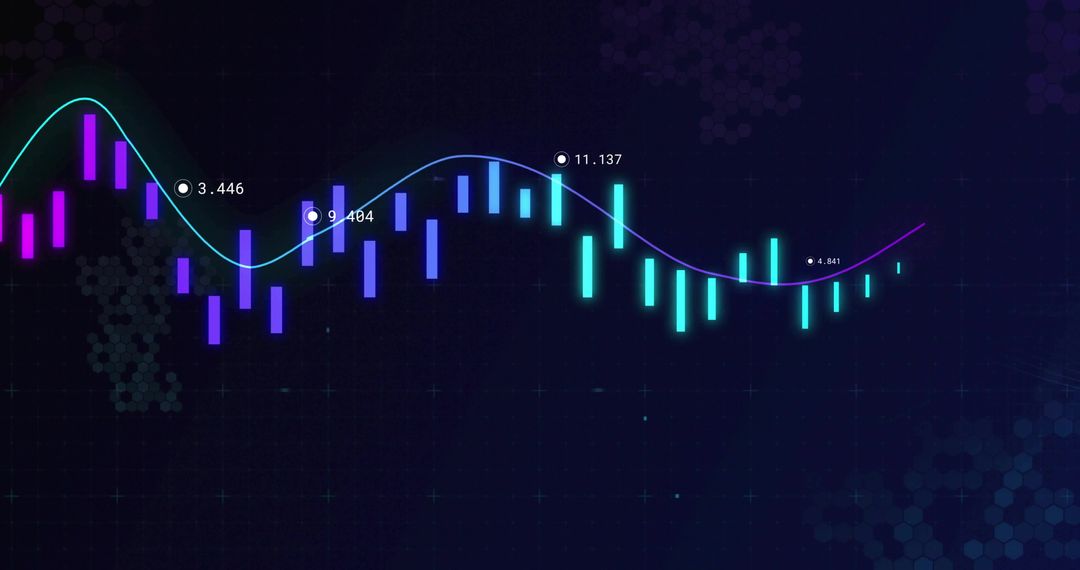
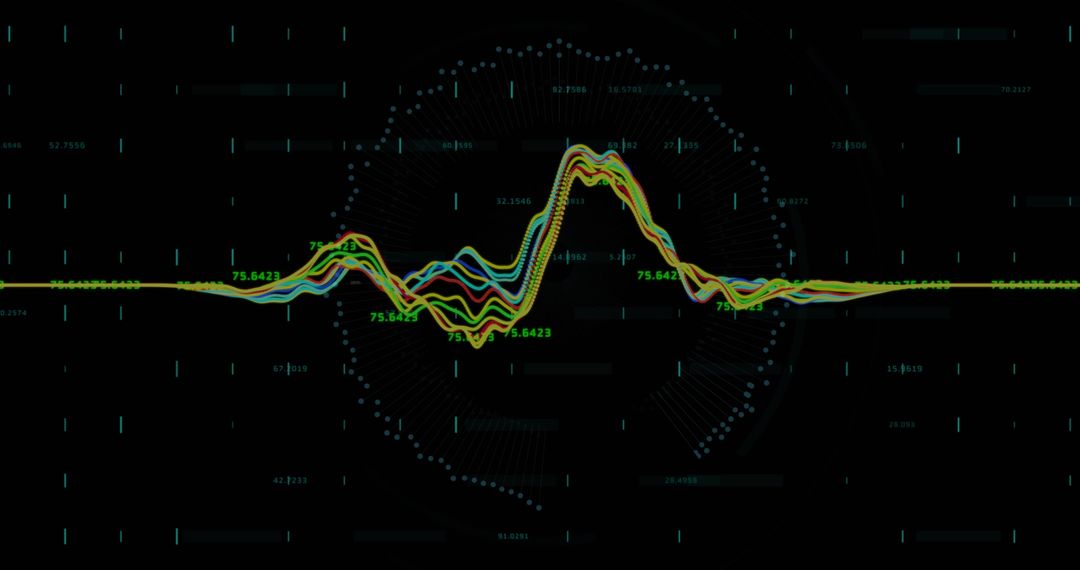
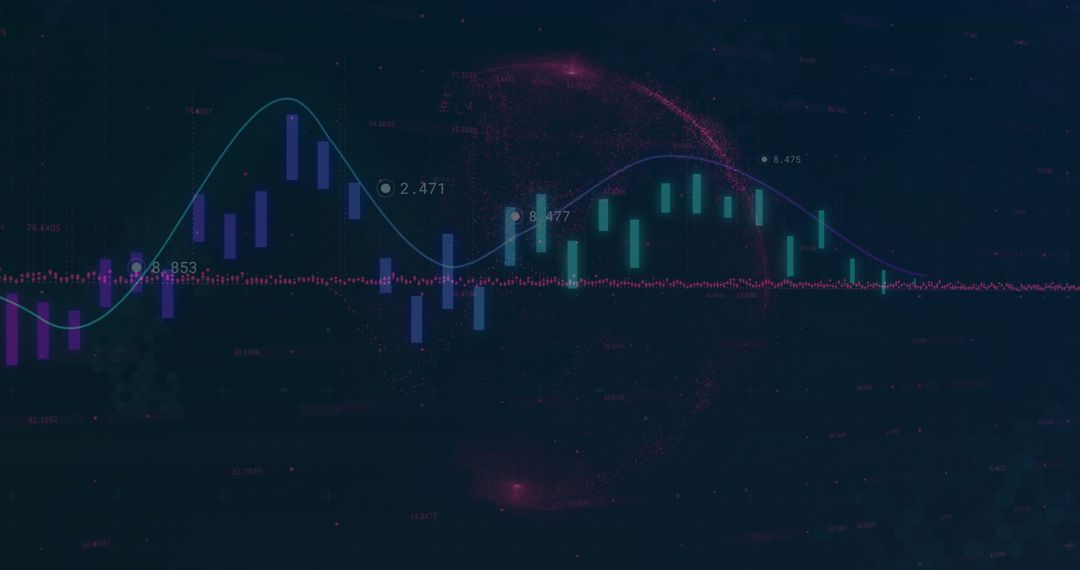
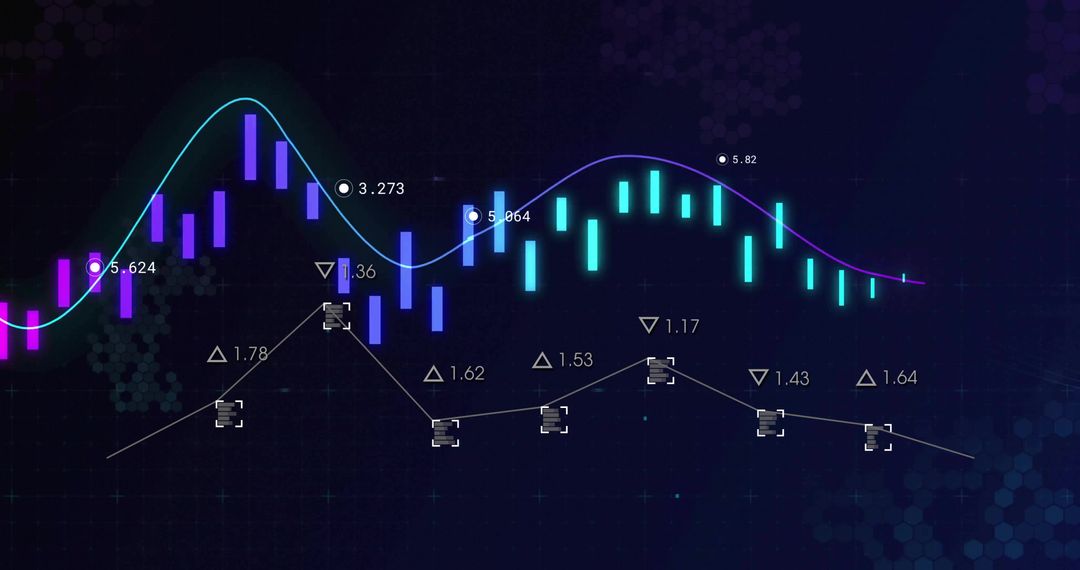
- Futuristic Data Dashboard Displaying Neon Waveform, Candlestick Charts and Concentric HUD
Futuristic Data Dashboard Displaying Neon Waveform, Candlestick Charts and Concentric HUD Image

Central concentric HUD with glowing rings and segmented indicators, overlaid by neon sinusoidal waveform and colorful candlestick bars. Dark navy background with hexagonal pattern and faint grid adding depth and high-tech atmosphere. Numeric markers and data points highlighting key price levels and trend signals. Composition featuring wide panoramic layout and central focus ring providing natural space for headlines or logos on left side. Dominant color palette: deep navy, cyan, teal, magenta, violet creating modern cyberpunk glow. Use cases: enhancing corporate presentations, powering fintech landing pages, decorating app headers, supporting marketing materials, illustrating editorial articles about markets and technology, serving as background for videos and social posts. Cropping advice: retain center ring for hero banners and crop sides for mobile thumbnails. Ideal for projects related to trading, finance, data analytics, artificial intelligence, blockchain, cybersecurity, and futuristic UI concepts.
Powered by 


0
downloads
downloads
Tags:
More
Credit Photo
If you would like to credit the Photo, here are some ways you can do so
Text Link
photo Link
<span class="text-link">
<span>
<a target="_blank" href=https://pikwizard.com/photo/futuristic-data-dashboard-displaying-neon-waveform-candlestick-charts-and-concentric-hud/d80cdccc204d024a5862faf356229eb4/>PikWizard</a>
</span>
</span>
<span class="image-link">
<span
style="margin: 0 0 20px 0; display: inline-block; vertical-align: middle; width: 100%;"
>
<a
target="_blank"
href="https://pikwizard.com/photo/futuristic-data-dashboard-displaying-neon-waveform-candlestick-charts-and-concentric-hud/d80cdccc204d024a5862faf356229eb4/"
style="text-decoration: none; font-size: 10px; margin: 0;"
>
<img src="https://pikwizard.com/pw/medium/d80cdccc204d024a5862faf356229eb4.jpg" style="margin: 0; width: 100%;" alt="" />
<p style="font-size: 12px; margin: 0;">PikWizard</p>
</a>
</span>
</span>
Free (free of charge)
Free for personal and commercial use.
Author: Authentic Images
Similar Free Stock Images

Premium


Premium


Premium


Premium


Premium


Premium


Premium


Premium


Premium


Premium


Premium


Premium


Premium


Premium


Premium


Premium


Premium


Premium


Premium


Premium


Premium


Premium


Premium


Premium