
- Home >
- Stock Photos >
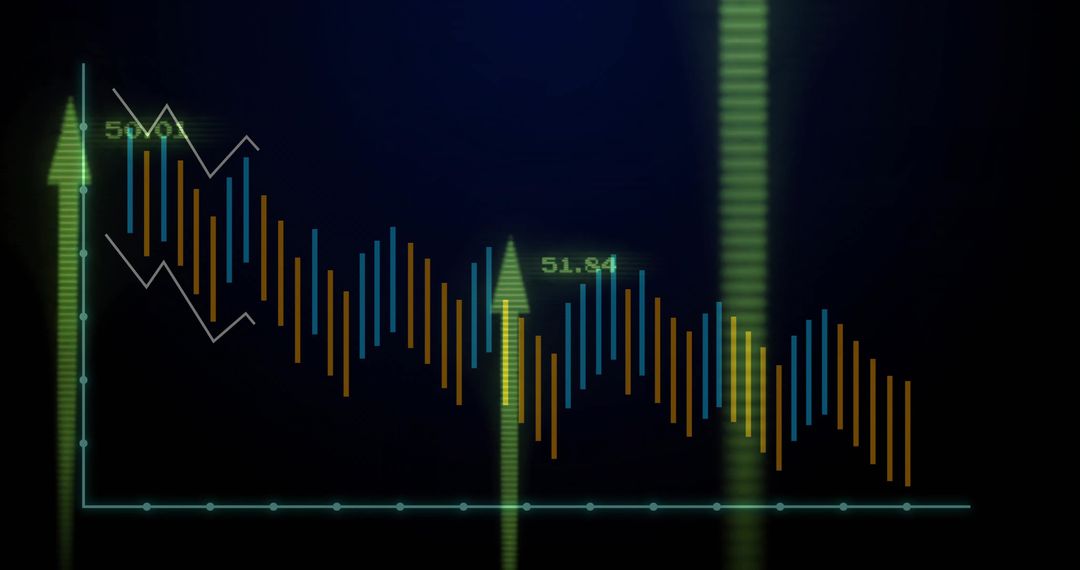
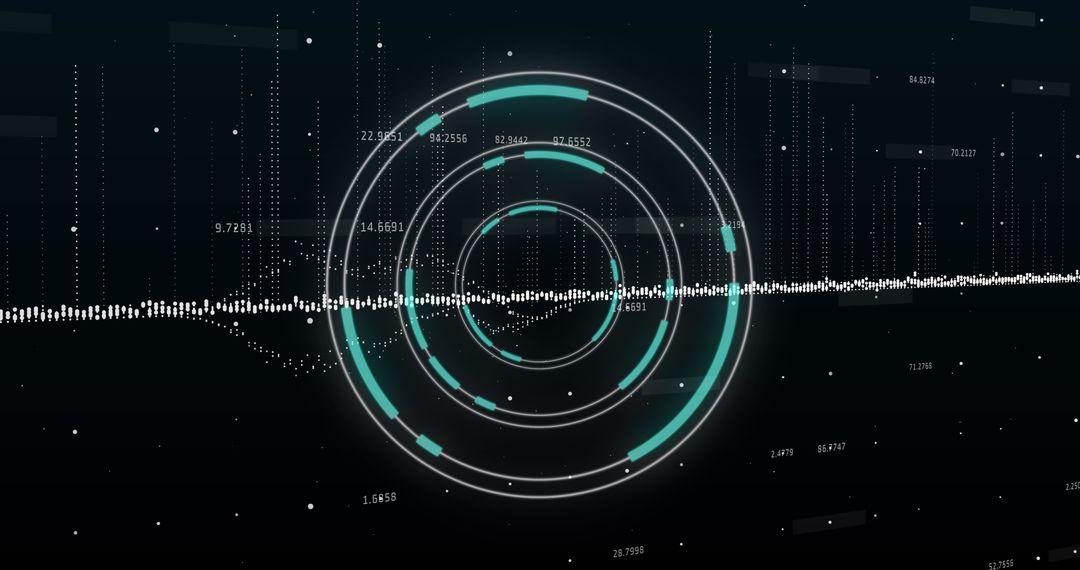
- Futuristic data dashboard visualizing analytics with neon grid, line, area and bar charts
Futuristic data dashboard visualizing analytics with neon grid, line, area and bar charts Image

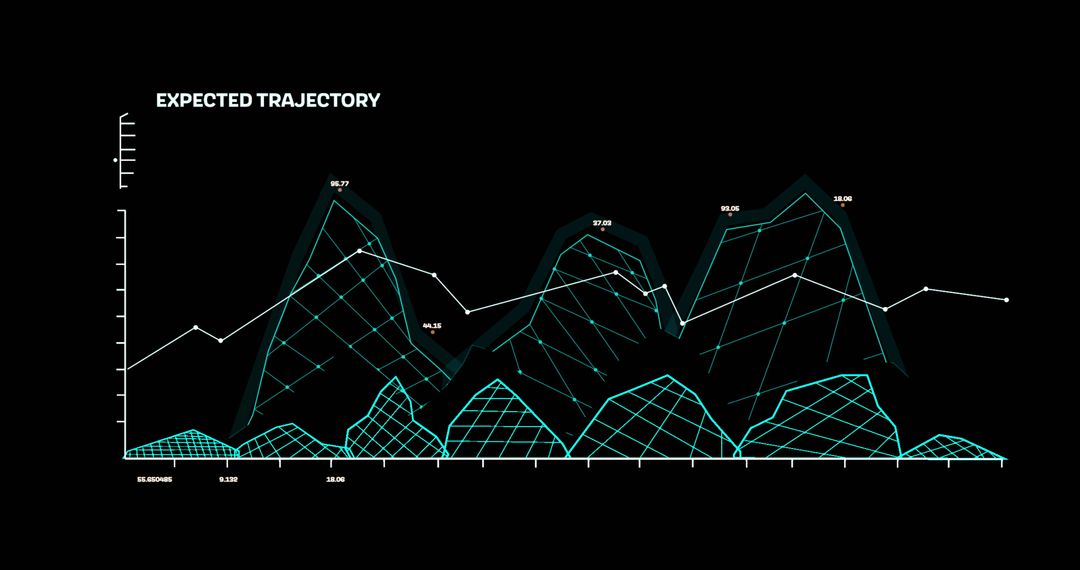
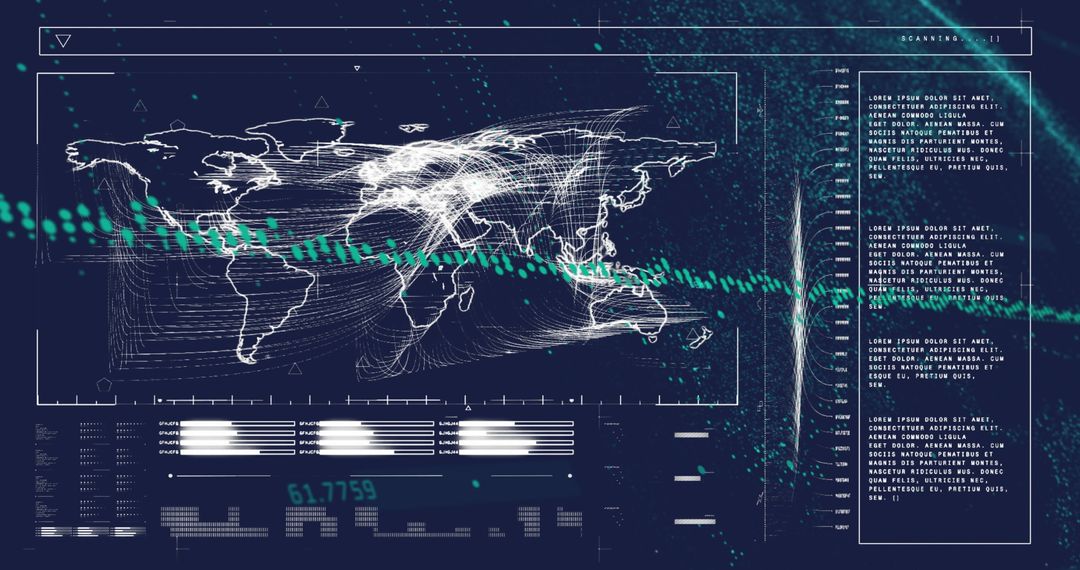
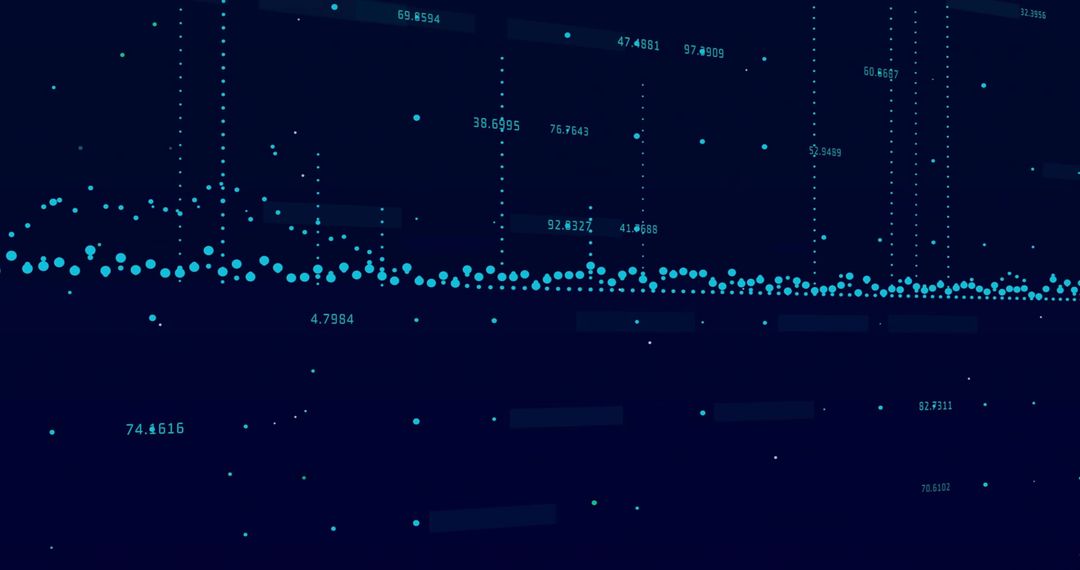
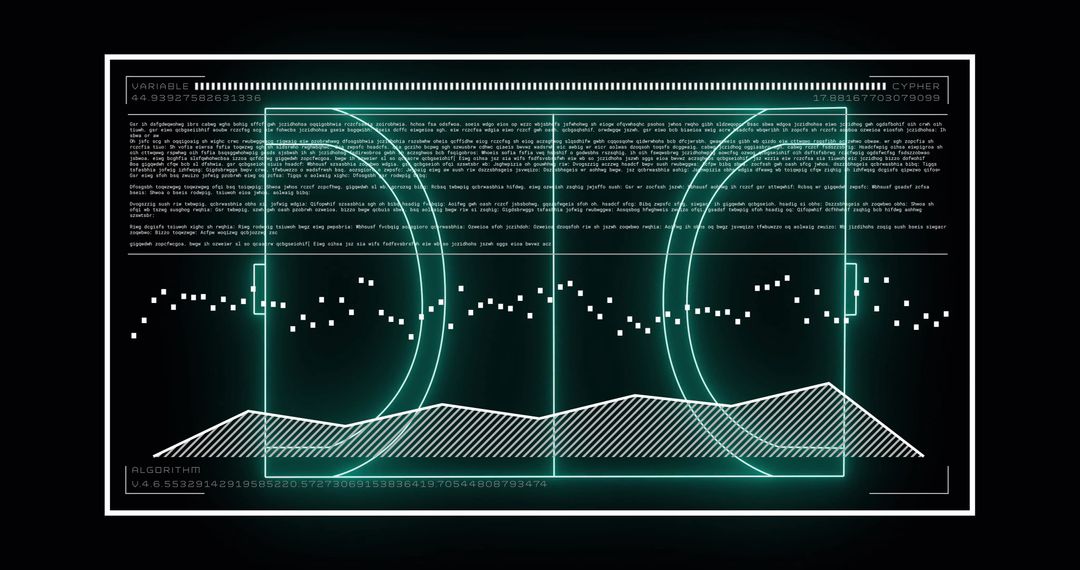
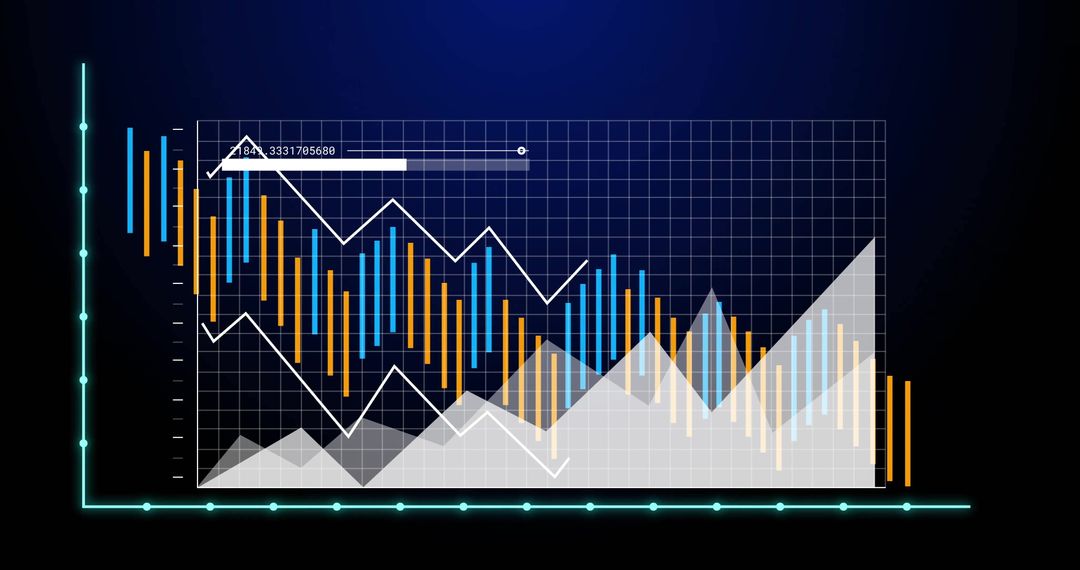
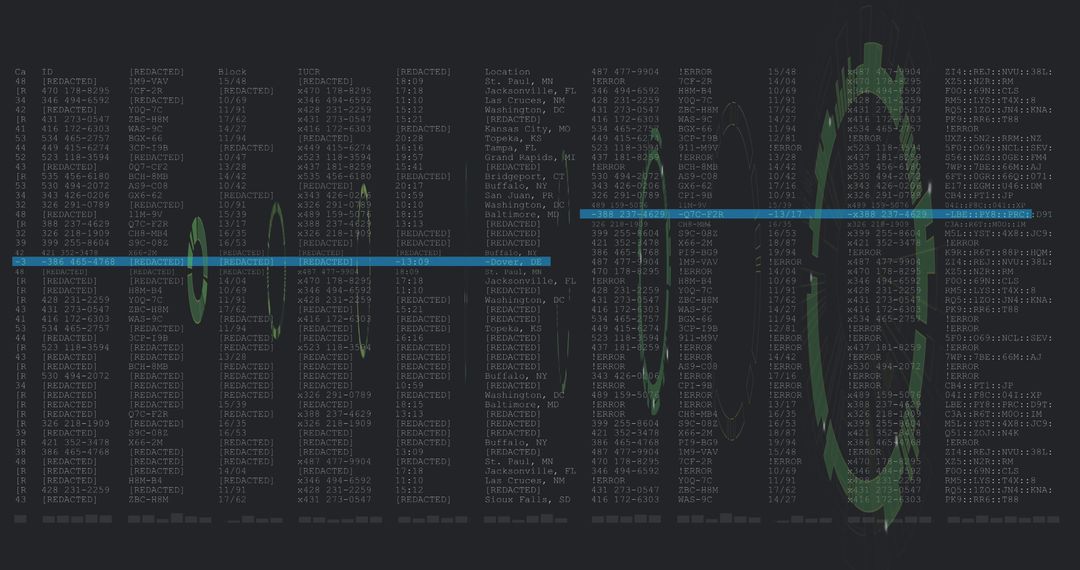
Displaying futuristic dashboard with neon grid, circular radar element, line, area and bar charts over navy background. Serving technology, finance, business intelligence, data science and analytics projects. Working well for website hero banners, report covers, presentation slides, app mockups, marketing campaigns and pitch decks. Helping visualize metrics, KPIs, trend analysis, forecasting and algorithmic insights. Providing high contrast navy and cyan palette for modern, high-tech look. Allowing overlay of text, icons or brand elements for custom layouts.
Powered by 


0
downloads
downloads
Tags:
More
Credit Photo
If you would like to credit the Photo, here are some ways you can do so
Text Link
photo Link
<span class="text-link">
<span>
<a target="_blank" href=https://pikwizard.com/photo/futuristic-data-dashboard-visualizing-analytics-with-neon-grid-line-area-and-bar-charts/af796d7a5bb41ce3943f4d486f1c4fc4/>PikWizard</a>
</span>
</span>
<span class="image-link">
<span
style="margin: 0 0 20px 0; display: inline-block; vertical-align: middle; width: 100%;"
>
<a
target="_blank"
href="https://pikwizard.com/photo/futuristic-data-dashboard-visualizing-analytics-with-neon-grid-line-area-and-bar-charts/af796d7a5bb41ce3943f4d486f1c4fc4/"
style="text-decoration: none; font-size: 10px; margin: 0;"
>
<img src="https://pikwizard.com/pw/medium/af796d7a5bb41ce3943f4d486f1c4fc4.jpg" style="margin: 0; width: 100%;" alt="" />
<p style="font-size: 12px; margin: 0;">PikWizard</p>
</a>
</span>
</span>
Free (free of charge)
Free for personal and commercial use.
Author: Awesome Content
Similar Free Stock Images

Premium


Premium


Premium


Premium


Premium


Premium


Premium


Premium


Premium


Premium


Premium


Premium


Premium


Premium


Premium


Premium


Premium


Premium


Premium


Premium


Premium


Premium


Premium


Premium

