
- Home >
- Stock Photos >
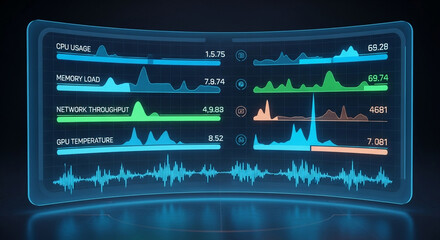
- Futuristic Data Dashboard with Waveform and V-shaped Graph
Futuristic Data Dashboard with Waveform and V-shaped Graph Image

This futuristic design portrays a digital screen blending waveform, V-shaped line graphs, and bars into a cohesive data dashboard. It conveys a strong sense of analytics and data analysis and showcases cutting-edge interface and technology concepts. This visual is ideal for presentations, tech blogs, and educational materials focusing on digital analytics, modern interface design, and technology-driven data solutions.
Powered by 


downloads
Tags:
More
Credit Photo
If you would like to credit the Photo, here are some ways you can do so
Text Link
photo Link
<span class="text-link">
<span>
<a target="_blank" href=https://pikwizard.com/photo/futuristic-data-dashboard-with-waveform-and-v-shaped-graph/0bd5fbb0fc18cc613ee1caf70a4536f2/>PikWizard</a>
</span>
</span>
<span class="image-link">
<span
style="margin: 0 0 20px 0; display: inline-block; vertical-align: middle; width: 100%;"
>
<a
target="_blank"
href="https://pikwizard.com/photo/futuristic-data-dashboard-with-waveform-and-v-shaped-graph/0bd5fbb0fc18cc613ee1caf70a4536f2/"
style="text-decoration: none; font-size: 10px; margin: 0;"
>
<img src="https://pikwizard.com/pw/medium/0bd5fbb0fc18cc613ee1caf70a4536f2.jpg" style="margin: 0; width: 100%;" alt="" />
<p style="font-size: 12px; margin: 0;">PikWizard</p>
</a>
</span>
</span>
Free (free of charge)
Free for personal and commercial use.
Author: Awesome Content
Similar Free Stock Images

Premium


Premium

Premium


Premium


Premium


Premium


Premium


Premium

Premium
Premium

Premium


Premium


Premium

Premium


Premium

Premium


Premium


Premium


Premium


Premium


Premium


Premium


Premium


Premium


Premium


Explore More Free Stock Images