- Home >
- Stock Photos >
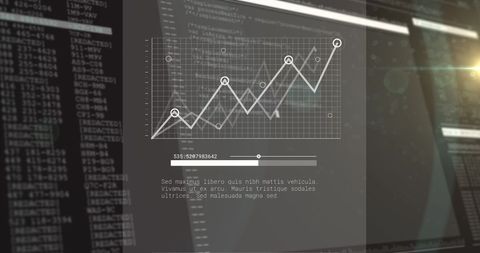
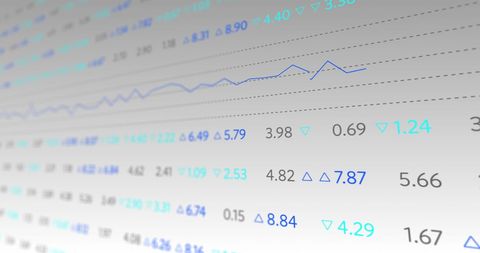
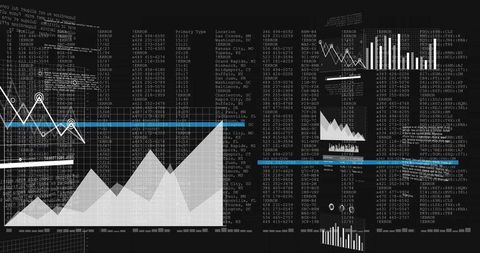
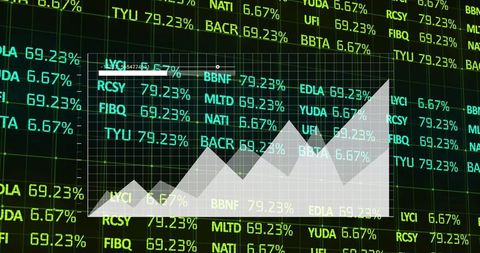
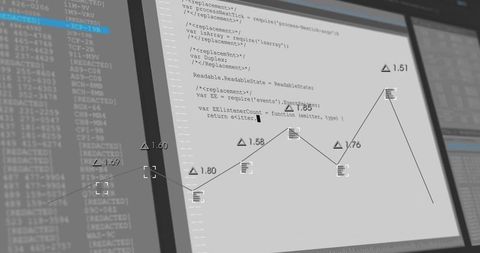
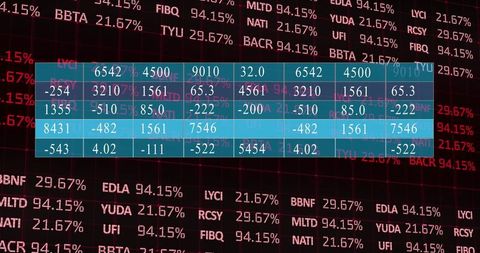
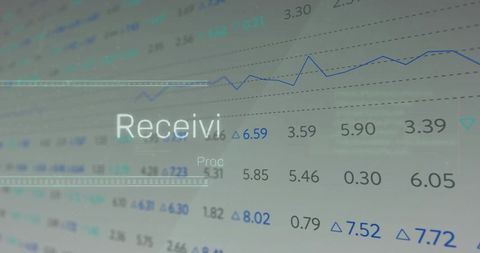
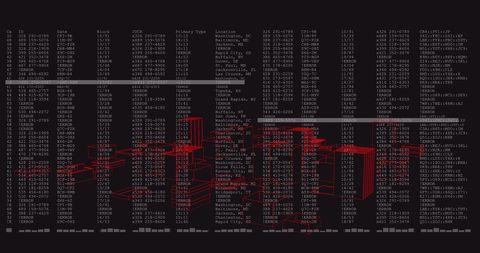
- Futuristic Data Visualization and Analytics on Digital Dashboard
Futuristic Data Visualization and Analytics on Digital Dashboard Image

Complex data patterns and charts creating an advanced tech feel, suitable for representing data analytics, programming concepts, or information technology themes. Ideal for use in tech blogs, educational resources, or innovation-driven websites focused on dashboards or digital advancements.

downloads
Tags:
More
Credit Photo
If you would like to credit the Photo, here are some ways you can do so
Text Link
photo Link
<span class="text-link">
<span>
<a target="_blank" href=https://pikwizard.com/photo/futuristic-data-visualization-and-analytics-on-digital-dashboard/e2ca976879bb8daa5c445c0276182fe7/>PikWizard</a>
</span>
</span>
<span class="image-link">
<span
style="margin: 0 0 20px 0; display: inline-block; vertical-align: middle; width: 100%;"
>
<a
target="_blank"
href="https://pikwizard.com/photo/futuristic-data-visualization-and-analytics-on-digital-dashboard/e2ca976879bb8daa5c445c0276182fe7/"
style="text-decoration: none; font-size: 10px; margin: 0;"
>
<img src="https://pikwizard.com/pw/medium/e2ca976879bb8daa5c445c0276182fe7.jpg" style="margin: 0; width: 100%;" alt="" />
<p style="font-size: 12px; margin: 0;">PikWizard</p>
</a>
</span>
</span>
Free (free of charge)
Free for personal and commercial use.
Author: Authentic Images