- Home >
- Stock Photos >
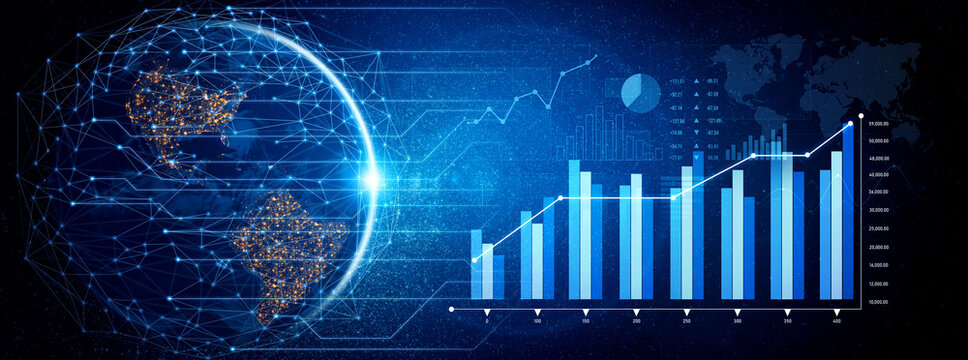
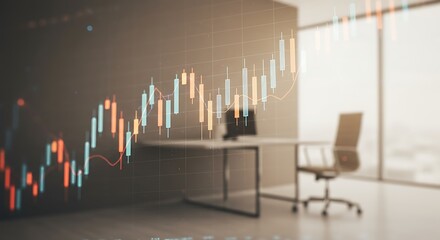
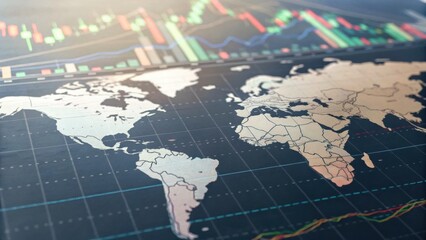
- Futuristic Data Visualization in Financial Markets
Futuristic Data Visualization in Financial Markets Image

The overlapping elements of graphs, a world map, and data processing suggest a futuristic financial setting. This is ideal for illustrating concepts in global economics, finance, analytics, and digital technology. Useful for financial publications, presentations, or websites focused on the finance industry and technological advancements in data analysis.
Powered by 


downloads
Tags:
More
Credit Photo
If you would like to credit the Photo, here are some ways you can do so
Text Link
photo Link
<span class="text-link">
<span>
<a target="_blank" href=https://pikwizard.com/photo/futuristic-data-visualization-in-financial-markets/e56915d5b91333670313130779a60ee2/>PikWizard</a>
</span>
</span>
<span class="image-link">
<span
style="margin: 0 0 20px 0; display: inline-block; vertical-align: middle; width: 100%;"
>
<a
target="_blank"
href="https://pikwizard.com/photo/futuristic-data-visualization-in-financial-markets/e56915d5b91333670313130779a60ee2/"
style="text-decoration: none; font-size: 10px; margin: 0;"
>
<img src="https://pikwizard.com/pw/medium/e56915d5b91333670313130779a60ee2.jpg" style="margin: 0; width: 100%;" alt="" />
<p style="font-size: 12px; margin: 0;">PikWizard</p>
</a>
</span>
</span>
Free (free of charge)
Free for personal and commercial use.
Author: People Creations
Similar Free Stock Images
Loading...

Premium

Premium

Premium


Premium


Premium


Premium

Premium


Premium


Premium


Premium


Premium


Premium


Premium


Premium


Premium

Premium


Premium


Premium


Premium


Premium
Premium

Premium


Premium


Premium


Premium