1. Home > 
  2. Stock Photos > 
  3. Futuristic Data Visualization with 3D Bar and Sphere Design

Futuristic Data Visualization with 3D Bar and Sphere Design Image

Futuristic Data Visualization with 3D Bar and Sphere Design

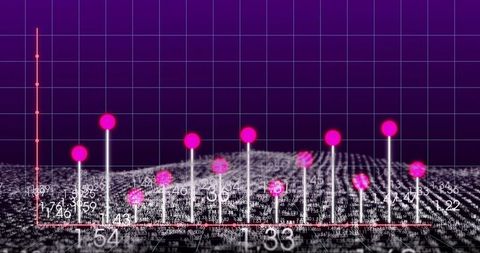
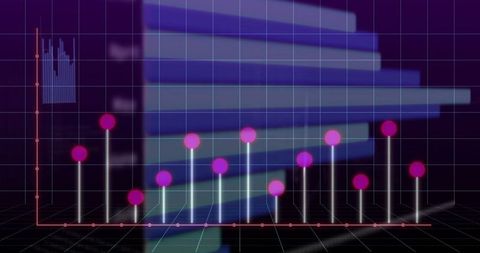
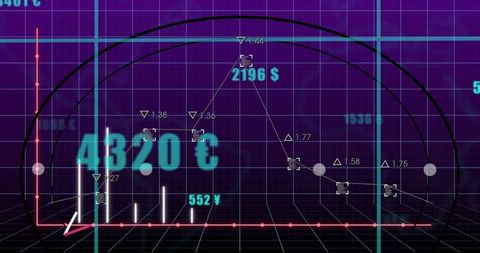
Futuristic design showcasing representation of data through 3D bars and vibrant magenta spheres against a digitally mirrored purple gradient is engaging. Useful for digital marketing, tech blogs, or graphics illustrating data analytics concepts. Aids in presentations focusing on complex data interaction, analytics processes, and innovative technology mindsets.

Powered by Shutterstock logo - Get 15% off with code: PIKWIZARD15
Displaying 3D bar-chart hovering over grid environment, with bars, magenta spheres, avatar bubble. Futuristic, digital, neon, illumination, data, analysis, technology - Powered by Shutterstock - Get 15% off with code: PIKWIZARD15Close-up of a blue data diagram on a computer screen - Powered by Shutterstock - Get 15% off with code: PIKWIZARD15Currency business and market charts - Powered by Shutterstock - Get 15% off with code: PIKWIZARD15THREE-DIMENSIONAL - technology and business concept - Powered by Shutterstock - Get 15% off with code: PIKWIZARD15the currency business and market charts - Powered by Shutterstock - Get 15% off with code: PIKWIZARD15

Credit Photo

If you would like to credit the Photo, here are some ways you can do so

Free (free of charge)

Free for personal and commercial use.

Author: Creative Art

Similar Free Stock Images

Global Financial Data Analysis with Colorful Graphs
Premium
Miniature figures businessman standing on a graph chart
Financial Data Graph with Digital Elements and Growth Indicators
Premium
Young analyst worker browsing infographics
Premium
Accessories for doing business in the office, on the table
Dynamic Stock Market Graphs and Financial Data
Abstract Digital Financial Data Chart with Pink Line Oscillations
Abstract Financial Charts with Graphs and Data Visualization
Black Background with Grid Pattern for Digital Design
Premium
Global network. Blockchain. 3D illustration. Neural networks and artificial intelligence. Abstract
Premium
Data Visualization: Colorful Cubes  Network Connections
Abstract Digital Data Graph and Diagrams on Gray Background
Colorful Bar Graph with Data Overlay on Black Background
Futuristic Digital Interface with Scanning Grid
Dynamic Financial Data Analysis in Digital Interface
Premium
View of a Colorfull survey stick graph interface with percentage over a device - Technology concept
AI
Colorful Stock Market Chart with Trend Analysis
Futuristic Financial Graph on Purple Retro Background
Digital Finance Analytics with Stock Market Data
Global Financial Network and Stock Market Analytics
Premium
Creative graphic backgrounds, digital wires transformation
Digital Finance: Holographic Trading and Tech Visualization
Futuristic Digital Stock Market Hologram and Coding Concept
Financial Data Visualization Over Futuristic Cityscape
Dynamic Financial Data Analysis with Illuminated Graphs
Premium
Artificial intelligence developers design chat assistants for seamless customer conversations.
Dynamic Financial Charts and Graphs Indicating Market Trends
Complex Data Analytics Overlay in High-Tech Server Room
Abstract Financial Data and Numbers in Virtual Environment
Retro Neon Style Financial Graph on Violet Grid
Premium
Image of abstract shapes over statistical data processing against clouds in the blue sky. Business data and cloud data storage technology concept
Dynamic Financial Growth Digital Chart Display
Dynamic Graph Illustration Depicting Financial Growth
Dynamic Financial Graph Visualizing Market Trends
Visual Display of Abstract Financial Data
Abstract Economy Concept with Graph and Urban Scenes
3D Holographic Chart on Futuristic Virtual Display
Premium
diagram
Global Finance and COVID-19 Impact Representation
Digital Interface Concept with Graphs and Media Icons
Digital Financial Data Chart with Modern City Skyscrapers
Digital Graphs Representing Data and Analytics on Black Background
Digital Graph with Rising and Falling Lines on Grid Background
Premium
business charts, 3D illustration
Premium
Business women hand pushing on 3d bar graph
Dynamic Financial Data Against Urban Skyline
Abstract Financial Graph On Black Background Representing Data Analysis
Abstract Digital Chart on Black Background Representing Data Analysis
Dynamic Financial Data Visualization with Binary Code Overlay
Premium
Interactive Business Growth Chart Data Visualization
Premium
Data Visualization: Colorful Cubes  Network Connections
Conceptual Financial Data and Scope Scanning Over Grid Background
Global Financial Data on Virtual Screen Displaying Stock Market Trends
Futuristic Data Visualization with Glowing Pink Spheres
Digital Fingerprint with Graph on Data Interface
Premium
Tablet computer and financial charts, neon hologram
Abstract Data Visualization with Dynamic Charts and Graphs
Futuristic Data Graph with Currency and Digital Overlay
Global Business Finance Data Analysis Visualization
Abstract Digital Chart in Futuristic Financial Analysis Concept
Premium
Silhouettes of business people using smartphones in blurry office with double exposure of cityscape and blurry growing graph. Global market concept. Toned image. Elements of image furnished by NASA
Futuristic Digital Cityscape with Data Interference
Dynamic Financial Data Visualization on Digital Grid Background
Abstract Financial Data Display with Upward Graph Curves
Premium
Rooftop with concrete terrace, Bangkok night skyline. Forecasting and business modeling of financial markets hologram digital charts. City downtown. Double exposure.
Futuristic Digital Finance World Map with Dynamic Data
Digital Interface with Data Graphs and Charts on Blue Background
Futuristic Data Processing Animation with Media Icons
Abstract Financial Chart Technology Interface
Premium
View of a Business stats displayed as graph on a futuristic interface - Business concept
Premium
Big data sphere visualization with text. HUD wireframe mesh sphere with dot and lines. Visual data infographics design. Science technology. Digital Data. Analysis of information.
Financial Stock Market Trends Over Digital Grid Background
Financial Data Overlay on Cityscape Visualizing Market Trends
High-Tech Financial Data Analysis Display with Graphs
Abstract Financial Data Processing and Analysis Interface
Data Analytics and Financial Growth Indicators
Neon Retro Graphs Display on Violet Grid Background
Digital Data Analytics Overlay on Cityscape
Holographic Financial Graph with Dynamic Line Chart
Premium
3d Business Graph isolated on white background
AI
Colorful Financial Stock Chart on Dark Background
Digital Data and Financial Charts on White Background
Abstract Digital Data Network with Graphs and Symbols
Data Visualization on Digital Grid with Technological Interface
Premium
Magnifying glass on data business graphs paper.
Premium
Visualizing 3D bar chart on blue screen, with overlaid line plot, curved surface, numeric labels. Infographics, analytics, data, digital, technology, innovation, dashboard
Futuristic Financial Data Analysis and Global Connections
Data Analysis Graphics on Digital Grid Background
Real-Time Financial Data Analysis with Graphs and Charts
Futuristic Data Visualization with Financial Statistics
Financial Graph and Waves Representing Market Trends and Data
Futuristic Data Processing Interface with Purple Grid Aesthetics
Digital Financial Graph with Dynamic Trading Analysis
Digital Financial Data Processing with Graphs and Charts
Digital Interface with Data Graphs and JavaScript Code
Eco-Friendly Icons Overlaid on Rising Stock Market Graph
Dynamic Lines Show Rising Financial Statistics Over Time
Digital Stock Market Green Graph Against Dark Trading Board
Financial Data Overlaid on Night Cityscape with Red Trend Line
Dynamic Line Chart with Histogram on Digital Grid Background
Dynamic Digital Graph Showing Global Data Movement
Financial Data Analysis on Blue Digital Interface
Digital Stock Market Analysis with Graphs and Charts
Abstract Data Visualization on Blue Background for Technology Concept
Futuristic Global Business Data with Digital Interface
Social Media and Stock Data Integration with Digital Graphics
Data Analysis with Advanced Technology Interface Details Profusion
Analyzing Financial Data on Digital World Map Background
Premium
Big data sphere visualization with text. HUD wireframe mesh sphere with dot and lines. Visual data infographics design. Science technology. Digital Data. Analysis of information.
Abstract Financial Data Visualization with Graphs
Global Financial Data Analysis Visualized with Futuristic Interface
Fluctuating Digital Stock Market Data Chart
Blue Squares and Digital Grid in Scanning Interface
Financial Growth Concept with Secured Investment Depiction
Digital Financial Data Graph on Black Screen Background
Cybersecurity and Biometrics in Digital Finance Innovations
Abstract Data Visualization Digital Chart Background
Bangladesh Flag Merged with Financial Data for Global Market Concept
Dynamic Financial Data Display in Digital Space
Futuristic Graph Showing Financial Growth with Neon Highlights
Financial Data Analytics with Digital Visualization Concept
Premium
chart diagram in hand digital
Premium
Magnifying glass and documents with analytics data lying on table,selective focus
Dynamic Financial Data Overlaid on Grid Background
Financial Data Graph Over Cityscape with Digital Overlay
Explore More Free Stock Images