
- Home >
- Stock Photos >
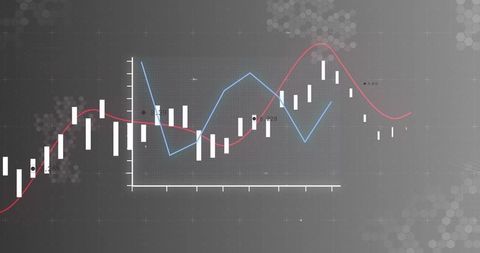
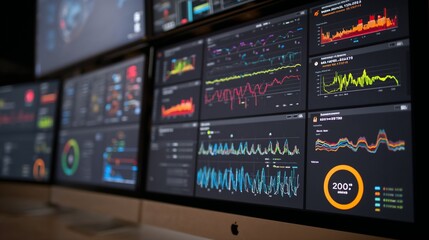
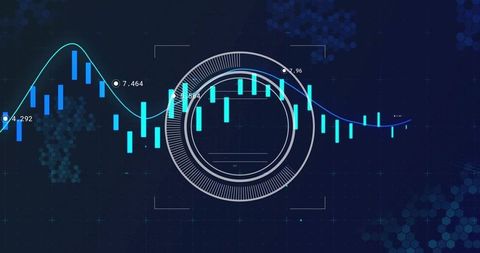
- Futuristic Data Visualization with Bars and Trend Line
Futuristic Data Visualization with Bars and Trend Line Image
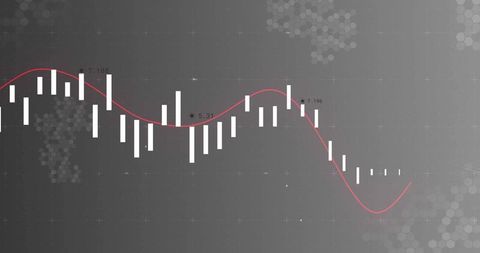
This graphic features a modern data visualization shown with white vertical bars that represent numerical values and a distinctive red trend line that indicates the data flow. Background elements have translucent grid and hexagonal shapes that provide a high-tech feel. Suitable for use in presentations related to analytics, technology interfaces, and financial overviews. Also effective for social media graphics related to data trends and innovation.
Powered by 


downloads
Tags:
More
Credit Photo
If you would like to credit the Photo, here are some ways you can do so
Text Link
photo Link
<span class="text-link">
<span>
<a target="_blank" href=https://pikwizard.com/photo/futuristic-data-visualization-with-bars-and-trend-line/3df90c29dcfaba43e7142137a7bfae19/>PikWizard</a>
</span>
</span>
<span class="image-link">
<span
style="margin: 0 0 20px 0; display: inline-block; vertical-align: middle; width: 100%;"
>
<a
target="_blank"
href="https://pikwizard.com/photo/futuristic-data-visualization-with-bars-and-trend-line/3df90c29dcfaba43e7142137a7bfae19/"
style="text-decoration: none; font-size: 10px; margin: 0;"
>
<img src="https://pikwizard.com/pw/medium/3df90c29dcfaba43e7142137a7bfae19.jpg" style="margin: 0; width: 100%;" alt="" />
<p style="font-size: 12px; margin: 0;">PikWizard</p>
</a>
</span>
</span>
Free (free of charge)
Free for personal and commercial use.
Author: Creative Art
Similar Free Stock Images

Premium


Premium


Premium


Premium


Premium


Premium

Premium


Premium


Premium


Premium
Premium


Premium


Premium


Premium


Premium

Premium

Premium


Premium

Premium


Premium

Premium


Premium


Premium


Premium


Premium


Explore More Free Stock Images