1. Home > 
  2. Stock Photos > 
  3. Futuristic Data Visualization with Graphs and QR Code

Futuristic Data Visualization with Graphs and QR Code Image

Futuristic Data Visualization with Graphs and QR Code

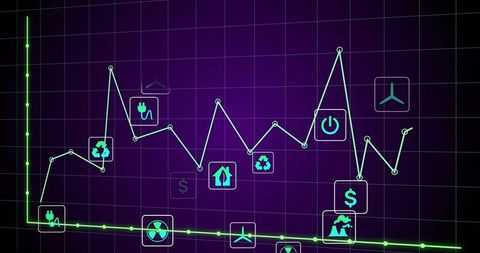
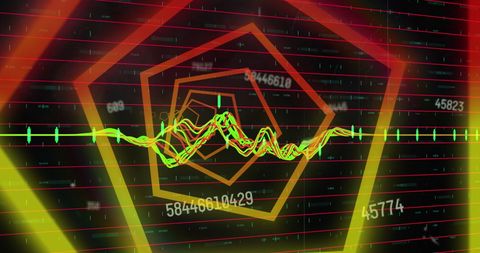
This dynamic and modern image displays an abstract digital interface, combining elements such as data graphs and a QR code framed within vibrant blue light the centerpiece of attention. Ideal for use in technology blogs, financial presentations, or modern marketing materials that emphasize innovation and digital future trends.

Powered by Adobe logo
Analyze vibrant stock trends with glowing neon graphs for modern business solutions and data visualization, financial insights, and investment strategies success - Powered by AdobeFloating graphs form a glowing spiral symbolizing data flow analytics and the visualization of complex information representing insight innovation and the dynamic movement of digital intelligence - Powered by AdobeGlass spheres with digital graphs symbolize global finance connection and innovation. Modern technology concept showing data visualization and global communication network in motion - Powered by AdobeDigital glowing arrow pointing upward symbolizing growth and progress over a futuristic data-driven technology and finance background with dynamic light effects - Powered by AdobeFuturistic financial data visualization with glowing blue line graphs and vertical bar chart, Abstract financial chart with rising graphs - Powered by Adobe

Credit Photo

If you would like to credit the Photo, here are some ways you can do so

Free (free of charge)

Free for personal and commercial use.

Author: Awesome Content

Similar Free Stock Images

Dynamic Graph with Glowing Points Representing Financial Data
Premium
Data Visualization Showing Colorful Graphs and Spikes on a Black Background With Glowing Lines
Financial Data Displayed Over City Skyline with Rising Graphs
Neon Green Football Field with Dynamic Data Streams
Bitcoin Symbol with Financial Data Dynamic Representation
Futuristic Digital Data Analytics Interface Display
Premium
A futuristic data visualization room featuring a transparent display of rising graphs and charts, highlighting growth and analytics.
Abstract Financial Data Visualization in Server Room
Data Processing and Stagflation Concept with NATO Emblem
Digital Financial Dashboard with Graphs and Data Visualization
Futuristic DNA Sequence with Digital Interface Elements
Premium
Digital data visualization with glowing orange graphs in a futuristic industrial setting
Dynamic Glowing Digital Graphs on 3D Grid Background
Abstract Digital Network and Technology Background
European Market Data Overlay with EU Flag and Financial Graphs
Data Analytics Graphs on Digital Interface Background
Premium
Hand interacting with futuristic digital data visualization screen
Digital Data Processing with Neon Grid Overlay
Abstract Digital Charts with Social Media Metrics Rising
Cloud Data Visualization and Analytics Design
Abstract Graphs Over Modern Building at Night
Premium
Floating graphs form a glowing spiral symbolizing data flow analytics and the visualization of complex information representing insight innovation and the dynamic movement of digital intelligence
Financial Data Visualization on Dark Background
Abstract Digital Interface Showing Data Analysis Concept
Futuristic Data Graph Overlay on City Skyline
Dynamic Financial Data Chart Showing Trend Analysis
Premium
Digital visualization of a glowing neon data graph rising upward pink and blue color financial growth and success graphs floating in dark space.
Digital Security Concept with Green Shield and Lock on Data Grid
Dynamic Data Analytics Display with Multicolored Graph Lines
Futuristic Energy Tracking with Rocket Blueprint and Data Analytics
Financial Growth Illustrated with Bar Charts and Upward Arrow
Abstract Digital Graphs Showing Financial Data Analysis
Dynamic Financial Data Display in Digital Space
Premium
A business professional analyzing futuristic digital graphs and analytics dashboards on a tablet, showcasing data visualization, financial growth, and business intelligence in a modern tech environmen
Abstract Digital Data Network with Graphs and Symbols
Financial Data Graph Rendering Global Market Trends
Rising Stock Market Graph on Blue Financial Background
Dynamic Line Chart with Histogram on Digital Grid Background
Premium
Man working on laptop with orange holographic charts in a futuristic office environment setting
Digital Data Analytics Overlay on Cityscape
Financial Data Analysis in Modern Server Room Environment
Dynamic Stock Market Graphs and Financial Data
Abstract Digital Charts Representing Network and Data Analysis
Premium
Abstract data visualization, light blue shapes, and graphs
Social Media Activity Icons on Digital Graph
Digital Financial Data Graph Showcasing Market Trends
Holographic Financial Graph with Dynamic Line Chart
Analyzing Construction Growth with Digital Charts
Premium
Abstract digital data visualization with illuminated bar graphs and glowing particles representing information flow and analytical data in a futuristic environment
Digital Financial Data and AI Illustration Networking Globally
Financial Growth Curve Over City Skyline Displaying Business Trends
Hexagonal Neon Tunnel with Data Processing Elements
Interactive Social Media Metrics Overlaid on Business Data Graph
Premium
Close up of a human hand touching a futuristic digital interface with glowing blue data visualizations and charts in a dark city background with bokeh lights
Abstract Data Network with Financial Analytics Overlay
Abstract Representation of Financial Data Processing
Dynamic Financial Data Displays Stock Market Trends
Abstract Digital Data and Network Connections Background
Premium
Businessman using AI predictive analytics with futuristic data visualization, graphs, and charts for business intelligence and technology solutions.
Futuristic Data Analytics with It's Glowing Sphere and Graphs
Interactive Digital Infographic with Callouts and Graph Elements
Displaying pixelated user profile overlaying blue and red trend lines on analytics panel
Abstract Financial Graph with Glowing Node on Grid Background
Digital Interface with Data Graphs and JavaScript Code
Financial Data Visualization Over Futuristic Cityscape
Premium
Displaying central data visualization in futuristic control room, with bar graphs and gauges
Digital Interface with Human Portrait and Data Graphs
Digital Graph Display with Dynamic Flux on Purple Background
Futuristic Neon Soccer Field Over HUD Interface
Digital Financial Data on Server with Stock Market Graph
Premium
Abstract futuristic digital data visualization with glowing geometric shapes and bars on a grid surface
Digital Financial Data with Graph and Grid Patterns
Digital Data Trends Over High-Tech Server Room
Abstract Digital Graph and Code on Violet Background
Futuristic Network Digital Interface Concept Art
Premium
Futuristic digital data visualization with glowing graphs and vibrant colorful light effects
Gamepad Icon Overlaid on Financial Data Chart
Dynamic Business Data and Cityscape Visualization
Digital Globe and Line Graph for Global Business Analysis
Rising Financial Data Graph on Digital Grid Background
Premium
An abstract futuristic cityscape featuring geometric white buildings interspersed with vibrant, multi-colored bar graphs representing data and growth. The scene is illuminated with soft, clean light.
Financial Data Analysis Vibrant Graphs on Blue Background
Data Visualization on Digital Interface with Graphs and Codes
Dynamic Financial Graphs Overlaying Urban Skyline
Dynamic Stock Market Graph with ECO Icons
Premium
Abstract digital data visualization with vibrant bar graphs
Financial Data with Molecular Background Concept
Modern Technology Network with Financial Data Visualization
Digital Stock Market Graph Red Trendline on Green Background
Futuristic Growth Hacking Data Analytics Concept
Premium
Laptop displays a brain scan with graphs and data, hinting at medical research in a lab setting
Financial Dashboard with Line and Bar Graphs for Market Analysis
Neon Energy Market Analytics Dashboard Showing Volatile Resource Trend Lines
Glowing Data Lines on Financial Graph Grid Background
Digital Finance Data Overlaying Futuristic Cityscape
Financial Data Analysis with Global Digital Interface
Abstract Financial Graph On Black Background Representing Data Analysis
Premium
Stacks of gold coins on digital screen with graph chart. Financial data visualization with increasing trend line. Coins stacked in growth pattern on futuristic background with blurred graphs.
Dynamic Financial Graph with Violet Background Concept
Rising Digital Graph and Data Visualizations on Black Background
Global Economy Displaying Growth Trends with Ukraine-NATO Financial Outlook
Digital Data Overlay on Modern Server Technology
Premium
This image depicts a futuristic data visualization featuring graphs and charts on an abstract globe, illustrating global trends and analytics in technology and business. Scalp
Dynamic Data Graphs on Digital Interface Background
Digital Data Flow Over 3D Grid with Blue Graph Representation
Abstract Financial Graphs on Dynamic Digital Interface
Dynamic Financial Growth Digital Chart Display
Premium
Blue digital graphs rising create futuristic financial background with glowing data
Dynamic Financial Graphs with Neon Lines and Shapes
Financial Graphs Overlaying Shopping Bag Representation Economy
Dynamic Financial Data Visualization on Digital Grid Background
Futuristic Financial Data Analysis with Rising White Line Graph
Premium
Woman analyzing data visualization on futuristic screen, exploring complex charts and graphs in modern tech interface
Dynamic Financial Graphs Overlaying Modern Cityscape
Global Financial Data Processing with Abstract Graphs
Dynamic Financial Data Overlaid on Grid Background
Businessman Using VR in Data Center with Virtual Graph Overlay
Premium
Abstract scatter plot with dummy data.
Financial Growth Stock Nikkei in Urban City Skyline
Digital Futuristic Interface with Neon Green Elements
Abstract Visualization of Data Analytics Dashboard with Speech Bubbles
Digital Finance Dashboard Showing Candlestick and Line Charts
Premium
Ultra realistic image of holographic data visualization projected above a sleek table, person s hand interacting with glowing graphs in futuristic
Neon Soccer Field Overlaying Financial Dashboard Showing Red and Blue Performance Trends