
- Home >
- Stock Photos >
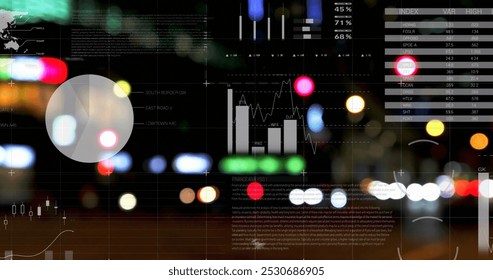
- Futuristic Digital Data Trends on Analytics Interface
Futuristic Digital Data Trends on Analytics Interface Image

Visual depiction of digital data trends highlighted on a high-tech interface screen, showcasing dynamic analysis capabilities. Ideal for use in presentations, data science materials, financial analysis reports, and technology innovation content.
Powered by  - Get 15% off with code: PIKWIZARD15


downloads
Tags:
More
Credit Photo
If you would like to credit the Photo, here are some ways you can do so
Text Link
photo Link
<span class="text-link">
<span>
<a target="_blank" href=https://pikwizard.com/photo/futuristic-digital-data-trends-on-analytics-interface/b6fd47caea9e1e805d6c1291b51a36a2/>PikWizard</a>
</span>
</span>
<span class="image-link">
<span
style="margin: 0 0 20px 0; display: inline-block; vertical-align: middle; width: 100%;"
>
<a
target="_blank"
href="https://pikwizard.com/photo/futuristic-digital-data-trends-on-analytics-interface/b6fd47caea9e1e805d6c1291b51a36a2/"
style="text-decoration: none; font-size: 10px; margin: 0;"
>
<img src="https://pikwizard.com/pw/medium/b6fd47caea9e1e805d6c1291b51a36a2.jpg" style="margin: 0; width: 100%;" alt="" />
<p style="font-size: 12px; margin: 0;">PikWizard</p>
</a>
</span>
</span>
Free (free of charge)
Free for personal and commercial use.
Author: Awesome Content
Similar Free Stock Images

Premium


Premium

Premium


Premium


Premium


Premium


Premium


Premium

Premium


Premium


Premium


Premium


Premium


Premium

Premium


Premium


Premium


Premium


Premium


Premium


Premium

Premium


Premium


Premium


Premium


Explore More Free Stock Images