1. Home > 
  2. Stock Photos > 
  3. Futuristic Digital Graph with Neon Data Analytics

Futuristic Digital Graph with Neon Data Analytics Image

Futuristic Digital Graph with Neon Data Analytics

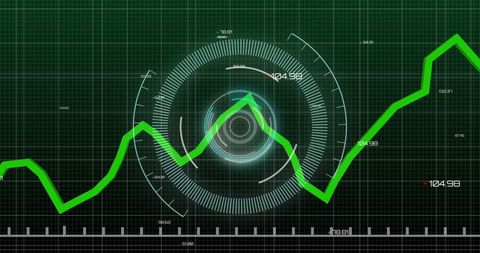
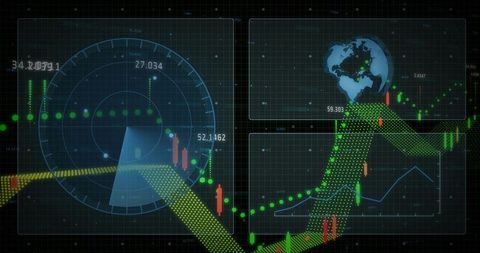
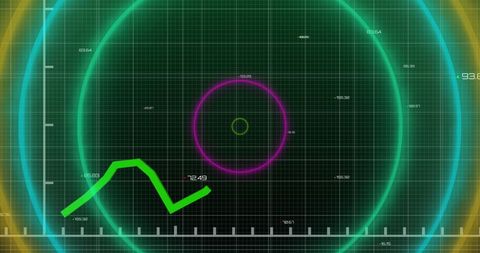
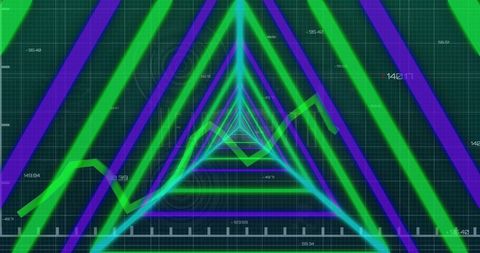
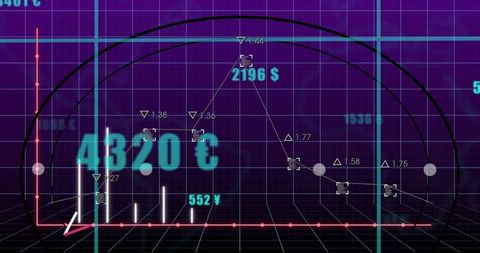
This image of a futuristic digital graph featuring neon elements and dynamic analytics represents cutting-edge data technology. The green color scheme and circular scanner design highlight concepts of digital processing and modern business analysis. Ideal for use in tech blogs, financial reports, presentations on the stock market or predictive analytics, and educational materials about data visualization technology and futuristic design concepts.

Powered by Adobe logo
Abstract tech image displays data analytics, gaming innovation. Artificial intelligence optimizes player behavior trends. Digital network, glowing circuits, processing information. Perfect futuristic - Powered by AdobeThe process of data analysis, search engine optimization (SEO), the use of magnifiers, charts, graphs, and ultraviolet and neon screens is enhanced by AI generative capabilities. - Powered by AdobeFuturistic control room with multiple monitors displaying data and graphs in vibrant neon colors. - Powered by AdobeFuturistic data center managing big data and financial market analytics - Powered by AdobeDigital data analyzing financial market charts with neon lights - Powered by Adobe

Credit Photo

If you would like to credit the Photo, here are some ways you can do so

Free (free of charge)

Free for personal and commercial use.

Author: People Creations

Similar Free Stock Images

Digital Data Processing Interface with Code and Graph
Premium
Vibrant Neon Infinity Symbol with Upward Trending Bar and Line Graphs
Abstract Digital Data Network with Graphs and Symbols
Digital Financial Data Analyzing Over Circular Grid Display
Digital Interface Showing Global Business Data Analytics
Futuristic Data Processing Animation with Media Icons
Premium
Low-poly AI chip paired with glowing stock market candlesticks on a blue tech background, blending financial innovation with neon aesthetics and futuristic vibes.
Financial Data Line Graph on Digital Display
Futuristic Digital Data Interface with Brain and Scope
Analyzing Data Trends on Digital Graph Interface
Futuristic Financial Data Visualization on Digital Interface
Premium
Futuristic Industrial Technology with Digital Data Analysis
Green Financial Line Graph with Candlestick Data on Grid Background
Digital Stock Market Green Graph Against Dark Trading Board
Digital Financial Data and Global Market Analysis on Graph
Data Analysis and Cybersecurity Concept Art
Premium
Illustrative digital interface showcases a handshake icon at the center, surrounded by glowing blue circular patterns, data charts, and a target, creating a futuristic and tech-driven visual...
Abstract Graph with Social Media Notification Icons and Data Points
Dynamic Data Chart on Dark Digital Background
Futuristic DNA Science and Data Processing Interface
Futuristic Data Visualization and Graph Analytics on Green Interface
Premium
Showing central circular UI glowing on screen with icons for search, thinking, analytics
Binary Code and Financial Data on Digital Screen
Dynamic Financial Chart with Red Line Graph on Digital Interface
Digital Stock Market Graph with Abstract Coding Background
Dynamic Red Line Graph With Data Points on Gridded Background
Premium
Data visualization dashboard with glowing digital analytics and orange highlights
Green Line Graph on Dark Digital Grid
Digital Financial Data Graph on Black Screen Background
Futuristic Data Graph with Currency and Digital Overlay
Futuristic Data Visualization with Dynamic Graphs and Digital Globe
Digital Interface with Data Processing Visualization
Financial Graph and Cityscape Analysis with Technological Overlay
Premium
Abstract digital landscape of glowing neon data peaks with vibrant light waves illustration
Digital Financial Data Display with Graph and Grid
Digital Interface with Global Financial Graphs Background
Fluctuating Digital Stock Market Data Chart
Digital Data Analysis with Green Line Graph on Grid Background
Premium
Blue Neon Glowing Data Analytics AI Microchip Pie Chart Bar Graph Waveform Technology Interface
Cryptocurrency Growth Chart Over Digital World Map
Futuristic Digital Network Interface With Interactive Wave Patterns
Digital Financial Data Graph Showcasing Market Trends
Digital Fingerprint with Graph on Data Interface
Premium
Digital data analyzing financial trading technology concept
Financial Statistics Superimposed on 3D Model
Dynamic Data Display Generating Business Growth Analysis
Digital Data Scanning Chart with Growing Trends
Abstract Digital Chart with Data Patterns and Technology Motif
Premium
AI generated image of a human hand interacting with a sci fi digital interface filled with analytical graphs glowing icons and real time data in a high tech environment.
Financial Growth Chart with Dynamic Green Line on Grid Overlay
Futuristic Data Processing Interface with Dynamic Graphs
Dynamic Green Line Graph Depicting Financial Data
Data Visualization on Security Shield Interface for Cyber Security
Premium
Dynamic data visualization showcasing business analytics, technology, and innovation concepts
NFT Financial Data Visualization with Digital Graph Overlay
Green Line Graph Overlapping Data Server Racks in Technology Center
Green Line Graph with Data Points on Grid Background
Fluctuating Financial Graph on Green Grid Background
Premium
Close up of a person s hands typing on a keyboard with glowing blue ai icons and data visualization graphics appearing on a digital interface
Digital Green Line Graph Over Grid with Statistics and Numbers
Dynamic Line Graph Displaying Data Trends on Beige Grid Background
Futuristic Neon Green Data Visualization on Grid Background
Data Analysis Process with Green Digital Interface
Dynamic Financial Data Visualization over Urban Silhouette
Financial Data Charts with World Map on Blue Digital Background
Premium
Pink Blue Digital Finance Chart Visualization
Data Analytics and Financial Growth Indicators
Innovative Data Analysis with Dynamic Line Graph and Digital Elements
Digital Financial Data Analysis with Growth Chart
Rising Data and Statistics on Global Map in Green Interface Design
Premium
Futuristic microchip with glowing data bars and rising arrow.
Futuristic Digital Interface with Scanning Data Dashboards
Dynamic Green Line Graph Showing Financial Data Fluctuations
Declining Financial Market Chart Over Grid Background
Rising Green Line Chart Overlays Concept of Financial Growth
Premium
Futuristic glowing bar graph showing data visualization with neon blue and pink light in a dark digital environment.
Digital Lock with Real-Time Data Display
Futuristic Digital Stock Market Chart with Interface
Digital Interface Concept with Data Circles and Graph
Green Data Graph on Black Digital Interface
Premium
Futuristic interface displays data visualizations with glowing neon accents, showcasing charts, graphs, and digital readouts for a modern, high-tech aesthetic.
Digital Data Prozessing with Global Interface Design
Declining Stock Market Graph with Red Trend Line
Cybersecurity Concept with Declining Data Graph and Digital Shield
Binary Code Financial Analytics with Rising Graph Line
Premium
A businessman holds a laptop displaying digital performance metrics with colorful charts and graphs in a modern urban setting at night. Impute
Business Growth Graphs Overlay Designer Creating Patterns
Green Graph Showing Forex Trends on Transparent Cyber Interface
Abstract Geometric Shapes Over Financial Data
Financial Growth Stock Nikkei in Urban City Skyline
Premium
Tech photo shows digital circuit board with neon pink data chart. Futuristic motherboard, electronic diagram with glowing line graph. IT business process analytics, ai system research.
Advanced Digital Dashboard with Rising Bar and Line Charts
Candlestick Chart Visualization with Indicators and Growth Highlight
Digital Currency Trading Interface with Data Visualization
Declining Graph with 49% Reduction on Dark Digital Background
Digital Financial Data Analysis with Graph and HUD Interface
Digital Financial Analysis with Infographic and Data Flow
Premium
Hand pointing at a digital interface showing a customer journey with icons for awareness, consideration, journey, and purchase
Green Line Rising on Digital Trading Board with Abstract Background
Futuristic Graph and Data Visualization Interface Design
Financial Graph Analysis on Green Grid Background
Digital Data Network with Dynamic Connections
Premium
Futuristic data analytics dashboard with flowing graph. 3D illustration of a digital dashboard with multiple data charts, glowing interfaces, and flowing graph lines, symbolizing AI and analytics.
Growth Trend with Green Line Overlay and Modern Cityscape
Dynamic Financial Data Visualizations on Grid Interface
Green Financial Line Chart Over Modern Office Buildings
Digital Finance Chart Overlaying Globe Background
Premium
Futuristic 3D Data Landscape With Glowing Grid Blocks.
Abstract Digital Data with Upward Trending Line Graph
Rising Graph Line on Digital Green Grid Background
Digital Data Processing Interface with Green Growth Chart
Futuristic Green Data Graph with Digital Interference Design
Premium
Futuristic technology interface displaying vital data and system diagnostics in a dark environment
Digital Data Processing with Tech Interface Graphs
Cybersecurity Data Analysis with Growth Trend Chart
Futuristic Digital Interface with Data Patterns
Line Graph Illustrating Data Trend on Green Digital Background
Premium
Digital data processing charts displaying abstract technology information
Global Currency Symbols on Financial Data Chart
Analyzing Growing Graph Line on Purple Gradient Background
Digital Graphs and Data Visualization on Green Background
Digital Financial Chart with Green Trend Line on Grid Background
Premium
Futuristic digital data streams on multiple screens.
Dynamic Line Chart Representing Financial Data Growth