- Home >
- Stock Photos >
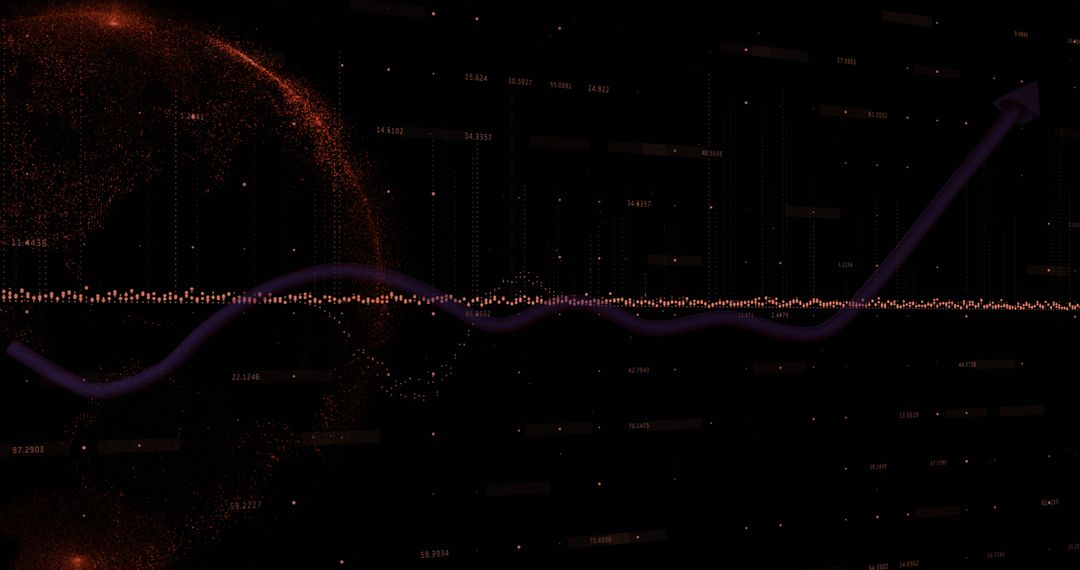
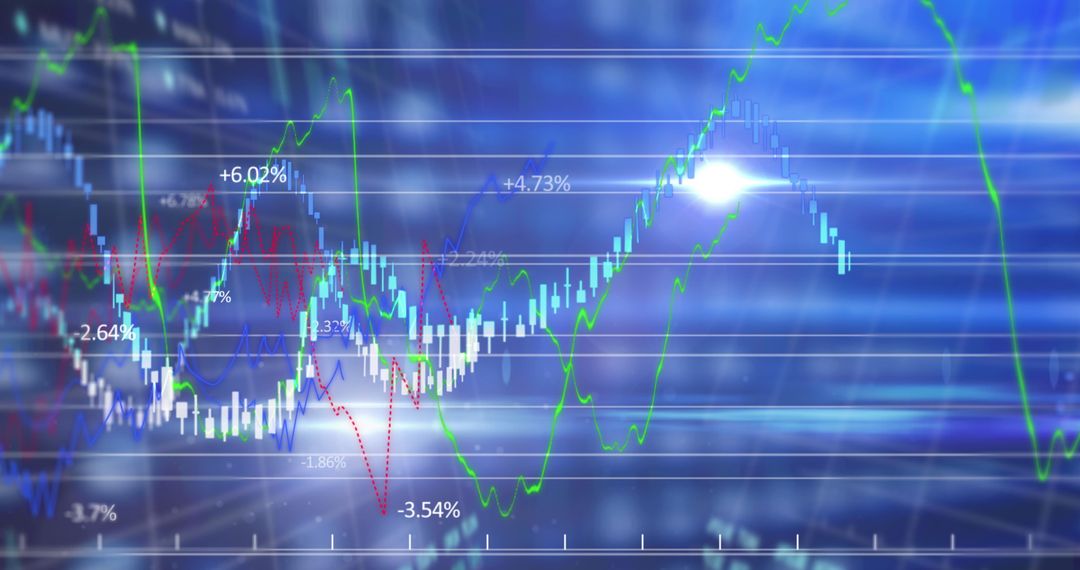
- Futuristic Digital Graphs and Lens Flare Illustrate Data Trends
Futuristic Digital Graphs and Lens Flare Illustrate Data Trends Image

This illustration of digital graphs with increasing numbers and bright lens flare communicates concepts of data analysis, technology, and finance. Ideal for use in reports, presentations, or marketing materials related to financial growth, technological advancements, or futuristic analytics. It evokes a sophisticated and dynamic understanding of modern data visualizations.
Powered by 


2
downloads
downloads
Tags:
More
Credit Photo
If you would like to credit the Photo, here are some ways you can do so
Text Link
photo Link
<span class="text-link">
<span>
<a target="_blank" href=https://pikwizard.com/photo/futuristic-digital-graphs-and-lens-flare-illustrate-data-trends/8b8fe455535185ce36c95b6ba474465c/>PikWizard</a>
</span>
</span>
<span class="image-link">
<span
style="margin: 0 0 20px 0; display: inline-block; vertical-align: middle; width: 100%;"
>
<a
target="_blank"
href="https://pikwizard.com/photo/futuristic-digital-graphs-and-lens-flare-illustrate-data-trends/8b8fe455535185ce36c95b6ba474465c/"
style="text-decoration: none; font-size: 10px; margin: 0;"
>
<img src="https://pikwizard.com/pw/medium/8b8fe455535185ce36c95b6ba474465c.jpg" style="margin: 0; width: 100%;" alt="" />
<p style="font-size: 12px; margin: 0;">PikWizard</p>
</a>
</span>
</span>
Free (free of charge)
Free for personal and commercial use.
Author: Creative Art
Similar Free Stock Images

Premium


Premium


Premium


Premium


Premium


Premium


Premium


Premium


Premium


Premium


Premium


Premium


Premium


Premium


Premium


Premium


Premium


Premium


Premium


Premium


Premium


Premium


Premium


Premium