1. Home > 
  2. Stock Photos > 
  3. Futuristic Digital Interface with Spinning Globe and Grid

Futuristic Digital Interface with Spinning Globe and Grid Image

Futuristic Digital Interface with Spinning Globe and Grid

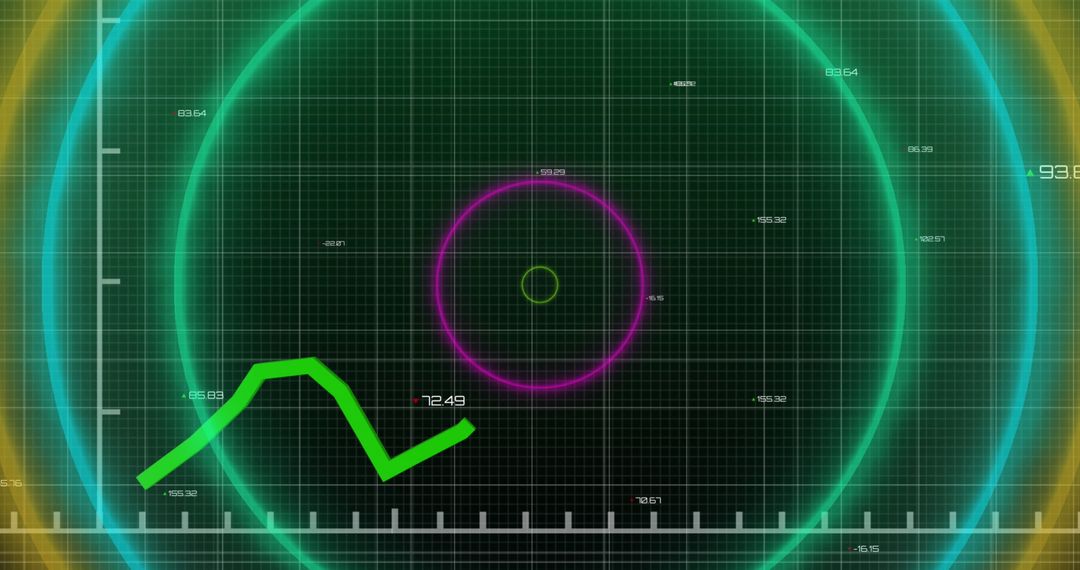
Futuristic design featuring green fluctuating line connecting points on interactive interface. Abstract globe symbolizes global connectivity in high-tech context. Useful for financial reports, technology presentations, or illustrating global business communications.

Powered by Shutterstock logo - Get 15% off with code: PIKWIZARD15
Displaying spinning globe and line graph overlay in rural field, with wind turbines and yellow crop. Renewable, sustainable, digital, environmental, technology, eco-friendly, futuristic - Powered by Shutterstock - Get 15% off with code: PIKWIZARD15Spinning wireframe globe displaying nodes in digital dashboard, with pie charts and percent labels. Data analytics, futuristic, digital interface, visualization, technology, network, intelligence - Powered by Shutterstock - Get 15% off with code: PIKWIZARD15Rotating holographic globe spinning in virtual interface, with grid, labels and streams, copy space. Cyberspace, technology, futurism, innovation, digital, network, data - Powered by Shutterstock - Get 15% off with code: PIKWIZARD15Spinning 3D Earth globe rotating in virtual financial data interface, with symbols and line charts. Globes, finance, data visualization, technology, investment, analytics, digital - Powered by Shutterstock - Get 15% off with code: PIKWIZARD15Spinning 3D globe with map grid overlay and circular gauge in control center, with display 156. Futuristic, technology, data, digital, holography, interface, visualization - Powered by Shutterstock - Get 15% off with code: PIKWIZARD15

Credit Photo

If you would like to credit the Photo, here are some ways you can do so

Free (free of charge)

Free for personal and commercial use.

Author: Authentic Images

Similar Free Stock Images

Red Declining Graph on Digital Grid Display Represents Falling Markets
Premium
3D Earth globe spinning in space, with colored columns, line curve, upward arrow, numeric labels. Geography, data visualization, technology, innovation, futuristic, analytics, digital
Global Economic Trends Highlighted on World Map with Graphs
Abstract Digital Globe with Data Visualizations
Dynamic Line Chart with Histogram on Digital Grid Background
Digital Financial Data Display with Graph and Grid
Innovative Data Analysis with Dynamic Line Graph and Digital Elements
Digital Financial Data Analysis with Growth Chart
Digital Data Visualization with Growth Arrow and Graphs
Dynamic Glowing Digital Graphs on 3D Grid Background
Digital Financial Data Graph Showcasing Market Trends
Growth Trend with Green Line Overlay and Modern Cityscape
Green Financial Line Chart Over Modern Office Buildings
Financial Graphs Displaying Business Trends on Grid Background
Abstract Digital Data with Upward Trending Line Graph
Rising Graph Line on Digital Green Grid Background
Green Data Graph on Black Digital Interface
Futuristic Green Data Graph with Digital Interference Design
Dynamic Financial Graph with Growth Patterns on Digital Screen
Green Line Graph Overlapping Data Server Racks in Technology Center
Global Financial Data Analysis with Colorful Graphs
Financial Data Visualization on World Map with Graph Analytics
Digital Globe with Data Interface Visualizing Technology
Futuristic Digital Globe with Geometric Data Integration
Dynamic Line Chart Representing Financial Data Growth
Dynamic Data Visualization with Fluctuating Trendline and Indicators
Digital Finance Network with Rotating Globe Interface
Abstract Global Finance and Data Analysis Conceptual Visual
Premium
Displaying wind turbines spinning on grassy plain, with digital globe, graphs and data overlays. Renewable, sustainability, innovation, environmental, visualization, technology, energy
Dynamic Financial Data Chart with Green Line Graph
Digital Financial Data Analysis with Graph and HUD Interface
Digital Interface Showing Global Business Data Analytics
Green Line Rising on Digital Trading Board with Abstract Background
Futuristic Graph and Data Visualization Interface Design
Dynamic Data Graphs on Digital Interface Background
Cryptocurrency Growth Chart Over Digital World Map
Digital Interface with Graphs and Data Lines in Cyber Space
Digital Fingerprint with Graph on Data Interface
Digital Stock Market Green Graph Against Dark Trading Board
Digital Financial Data and Global Market Analysis on Graph
Data Visualizations: Global Finance and Economy Metrics
Social Media and Stock Data Integration with Digital Graphics
Digital Data Processing Interface with Green Growth Chart
Dynamic Green Line Graph Depicting Financial Data
Financial Data with Fluctuating Graph Lines on Grid Background
Dynamic Red Line Graph With Data Points on Gridded Background
Business Colleagues Analyzing Financial Graph in Office Meeting
Abstract Digital Interface Showing Data Analysis Concept
Green Line Graph on Dark Digital Grid
Digital Green Line Graph Over Grid with Statistics and Numbers
3D Globe with Virtual Line Chart in Neon Digital Interface
Red Line Chart Trending Downward in Data Visualization
Digital Financial Data Chart with Modern City Skyscrapers
Financial Data Analysis with Global Digital Interface
Abstract Digital Data Network with Graphs and Symbols
Premium
Rendering Earth globe spinning over red map in network, featuring bold FUNK text, floating icons. Global, technology, innovation, digital, futuristic, connectivity, sustainability
Digital Financial Data Analyzing Over Circular Grid Display
Futuristic Data Processing Animation with Media Icons
Global Data Analytics on Digital Grid Interface
Rising Data and Statistics on Global Map in Green Interface Design
Digital Concept of Stagflation with Chart and Globe Illustration
Dynamic Data Flow with Analytics Visuals on Grid
Dynamic Green Line Graph Showing Financial Data Fluctuations
Futuristic Digital Finance World Map with Dynamic Data
Digital Earth with Global Business Data Analysis Interface
Digital Lock with Real-Time Data Display
Colleagues Analyzing Financial Data on Digital Grid Interface
Dynamic Financial Data Visualization on Digital Grid Background
Dynamic Data Chart on Dark Digital Background
Cybersecurity Concept with Declining Data Graph and Digital Shield
Dynamic Global Data Insights with Trend Lines
Green Line Graph with Data Points on Grid Background
Abstract Digital Financial Data With Globe Visualization
Abstract Data Network with Financial Analytics Overlay
Financial Growth Stock Nikkei in Urban City Skyline
Digital Financial Chart with Green Trend Line on Grid Background
Green Trend Line on Dark Grid Represents Economic Growth
Digital Financial Analytics with Red Trends on Grid Screen
Futuristic Digital Interface with Green Global Data Visualization
Financial Graph and Cityscape Analysis with Technological Overlay
Digital Fingerprint Over Financial Data Visualization
Financial Data Charts with World Map on Blue Digital Background
Premium
Image of digital interface with green line and  bitcoin symbols over globe spinning and model of plane. Global digital online concept digitally generated image.
Fluctuating Digital Stock Market Data Chart
Digital Data Analysis with Green Line Graph on Grid Background
Diverse Female Colleagues Analyzing Market Trends on Laptop
Slumpflation Concept Amidst Green Graph and Globe
Social Media Activity Icons on Digital Graph
Financial Market Growth Over City Skyline
Green Financial Line Graph with Candlestick Data on Grid Background
Digital Globe and Line Graph for Global Business Analysis
Business Women Analyzing Data in Office with Growth Chart Overlay
Digital Interface Concept with Data Circles and Graph
Global Economy Visualization with Data Analytics Concept
Financial Data Overlaid on Night Cityscape with Red Trend Line
Cybersecurity Data Analysis with Growth Trend Chart
Digital Stock Market Graph with Abstract Coding Background
Green Graph Showing Forex Trends on Transparent Cyber Interface
Fluctuating Financial Graph on Green Grid Background
Colorful Financial Chart Representing Stock Market Trends
Abstract Digital Data and Network Connections Background
Red Zigzag Graph on Digital Analytics Dashboard Interface
Fluctuating Line Graph on Analytics Dashboard
Global Financial Data Visualization With Neon Green Trend Line Over Teal Wireframe Globe