- Home >
- Stock Photos >
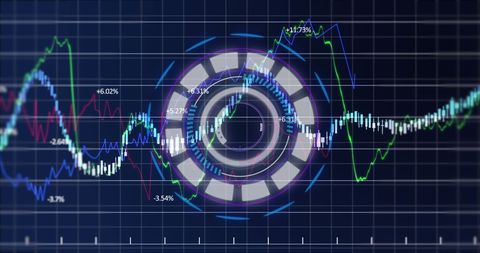
- Futuristic Digital Stock Market Chart with Interface
Futuristic Digital Stock Market Chart with Interface Image

The visually engaging scene depicts a digital graph displaying fluctuating stock market trends with a futuristic interface. This could be used in articles and presentations about financial analysis, investment strategies, and technological advancements in stock market forecasting tools. It offers a modern take on economic data and analytics.
Powered by 


2
downloads
downloads
Tags:
More
Credit Photo
If you would like to credit the Photo, here are some ways you can do so
Text Link
photo Link
<span class="text-link">
<span>
<a target="_blank" href=https://pikwizard.com/photo/futuristic-digital-stock-market-chart-with-interface/87cabe7bf432b81223cef2a16745cd62/>PikWizard</a>
</span>
</span>
<span class="image-link">
<span
style="margin: 0 0 20px 0; display: inline-block; vertical-align: middle; width: 100%;"
>
<a
target="_blank"
href="https://pikwizard.com/photo/futuristic-digital-stock-market-chart-with-interface/87cabe7bf432b81223cef2a16745cd62/"
style="text-decoration: none; font-size: 10px; margin: 0;"
>
<img src="https://pikwizard.com/pw/medium/87cabe7bf432b81223cef2a16745cd62.jpg" style="margin: 0; width: 100%;" alt="" />
<p style="font-size: 12px; margin: 0;">PikWizard</p>
</a>
</span>
</span>
Free (free of charge)
Free for personal and commercial use.
Author: Creative Art
Similar Free Stock Images
Loading...

Premium


Premium

Premium


Premium


Premium


Premium


Premium


Premium


Premium


Premium


Premium


Premium


Premium


Premium


Premium


Premium


Premium


Premium


Premium


Premium


Premium

Premium


Premium


Premium


Premium