- Home >
- Stock Photos >
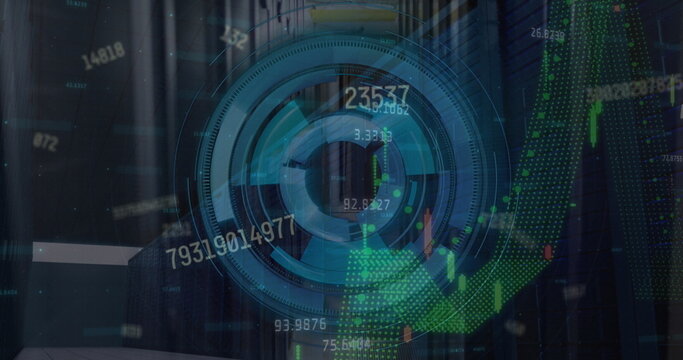
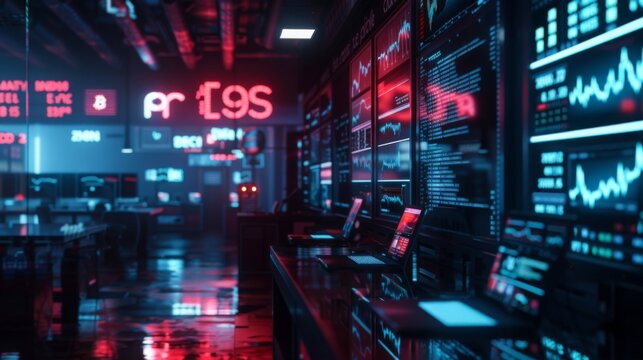
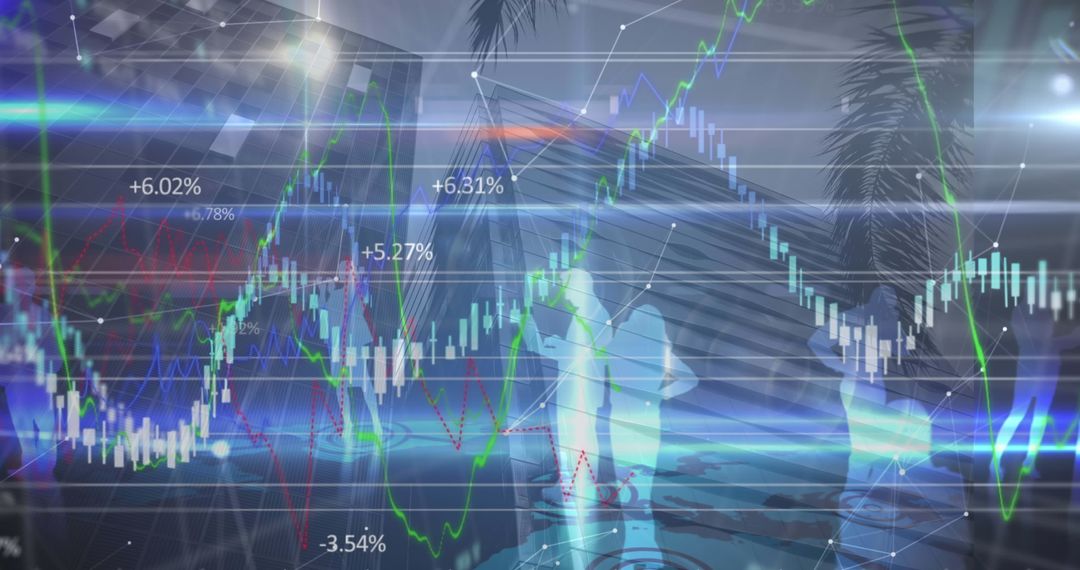
- Futuristic finance dashboard overlaying datacenter racks with neon charts and metrics
Futuristic finance dashboard overlaying datacenter racks with neon charts and metrics Image

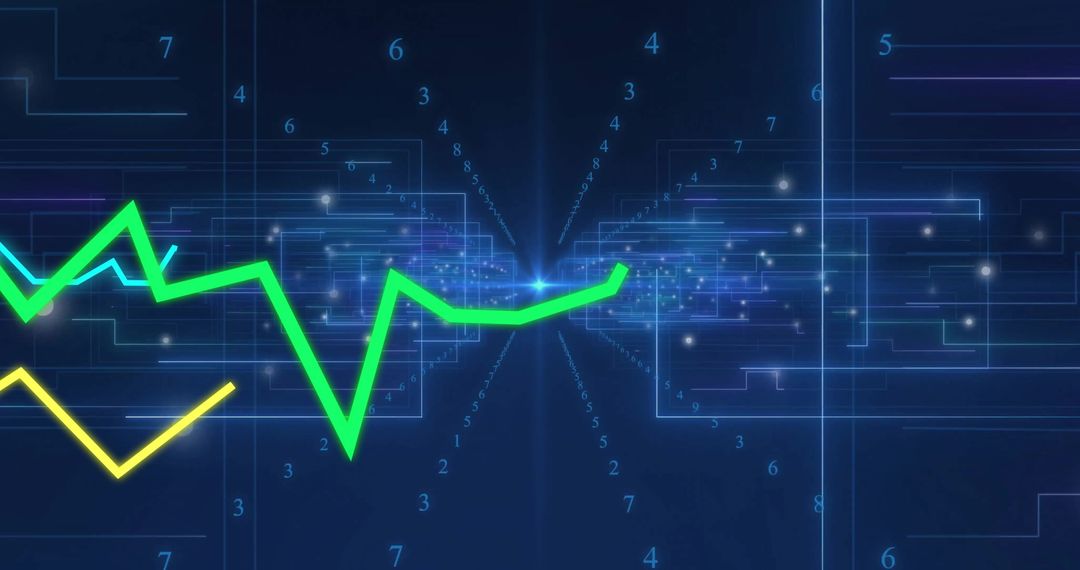
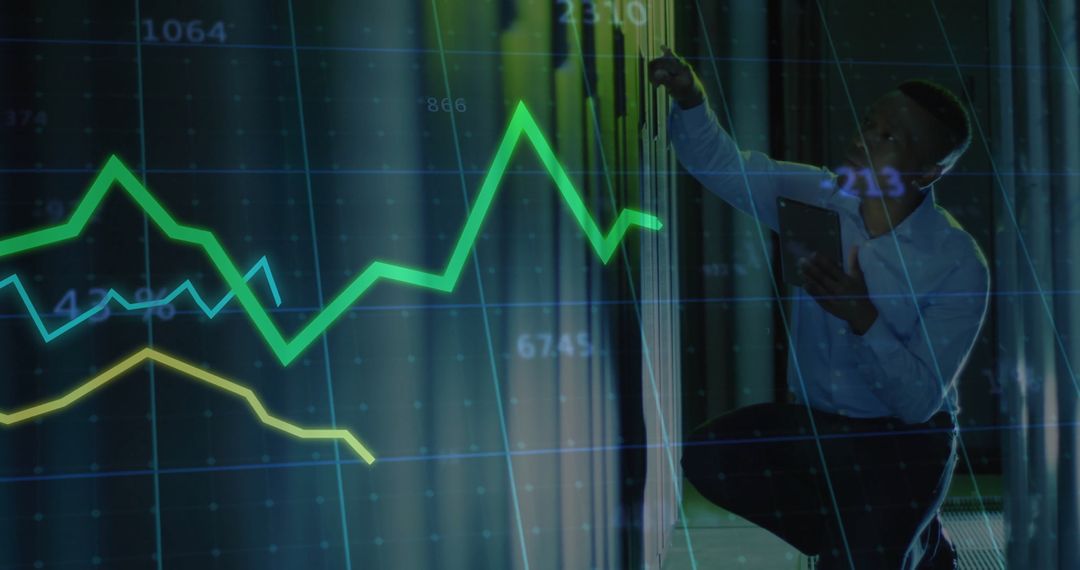
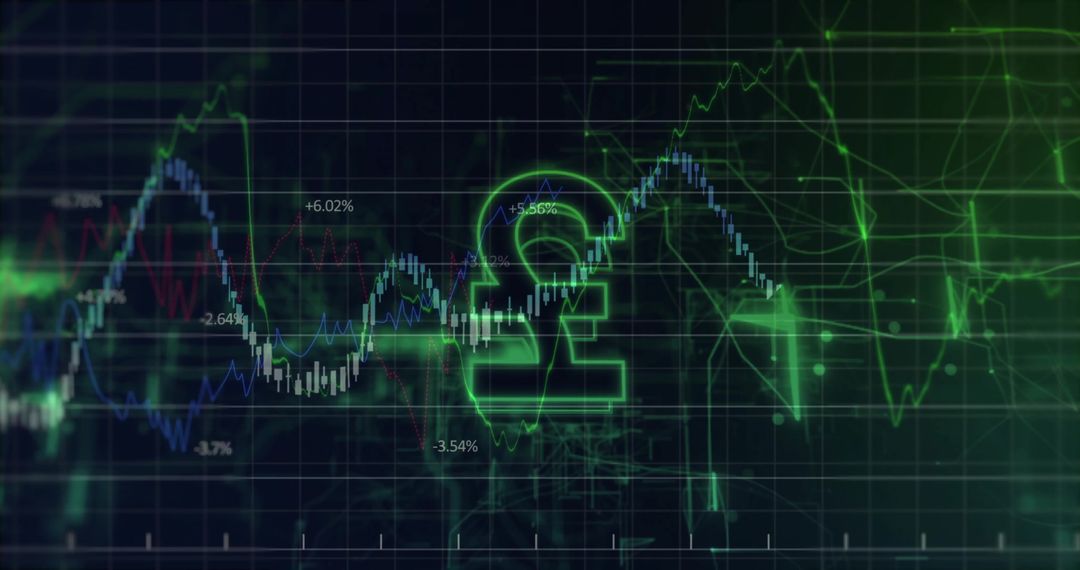
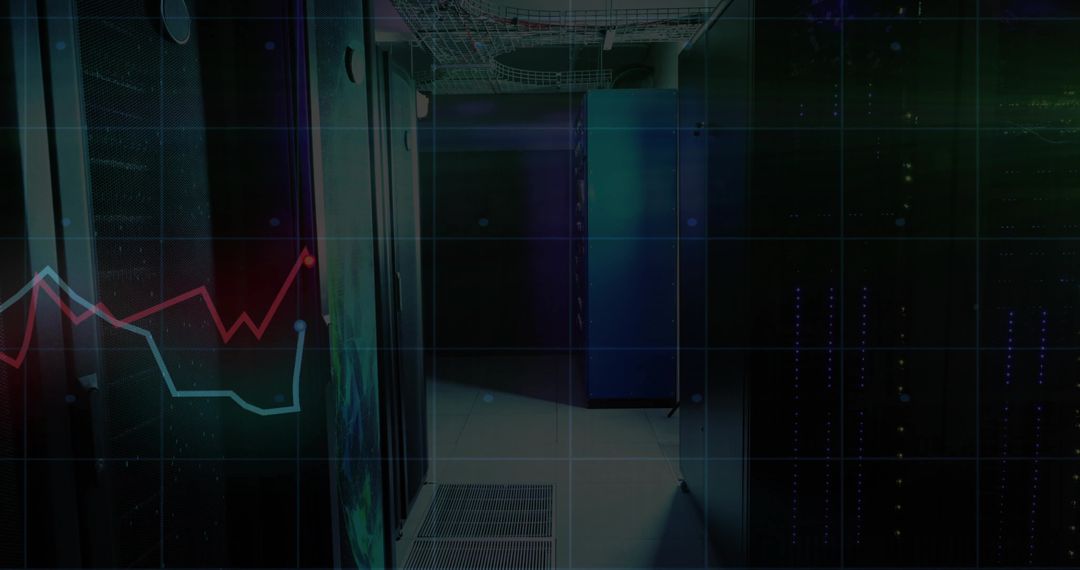
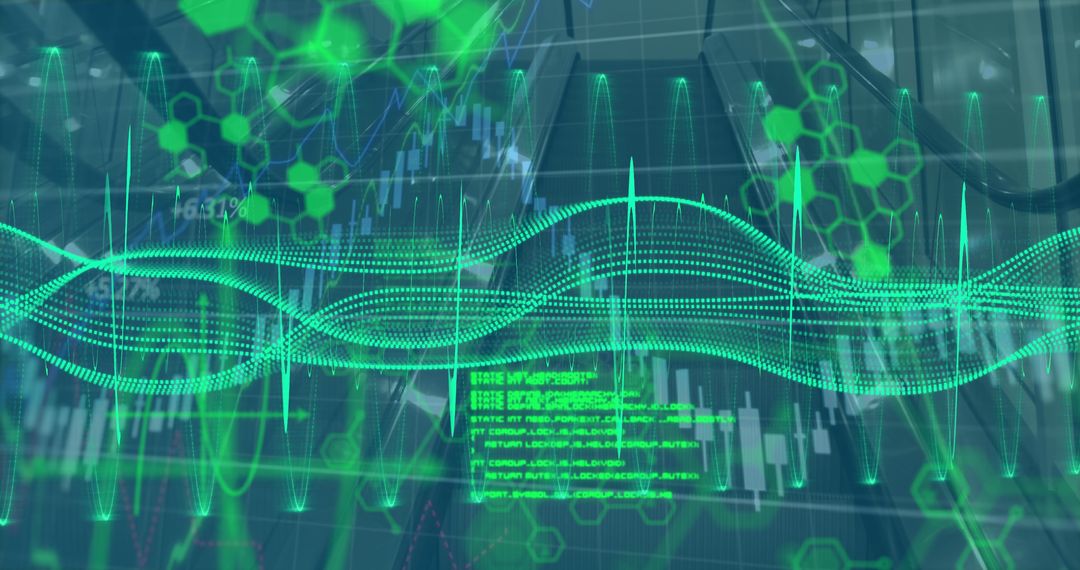
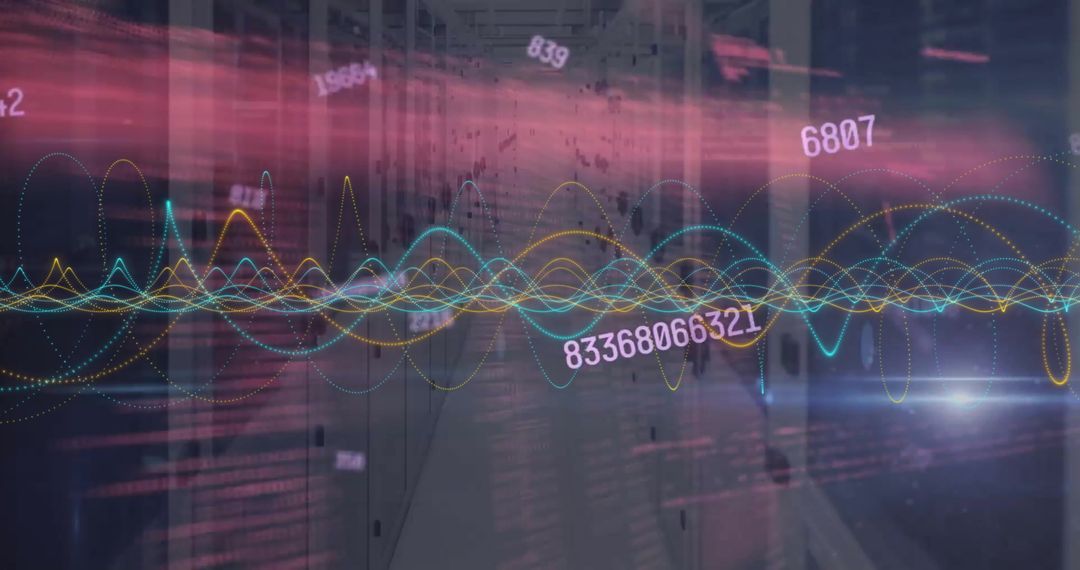
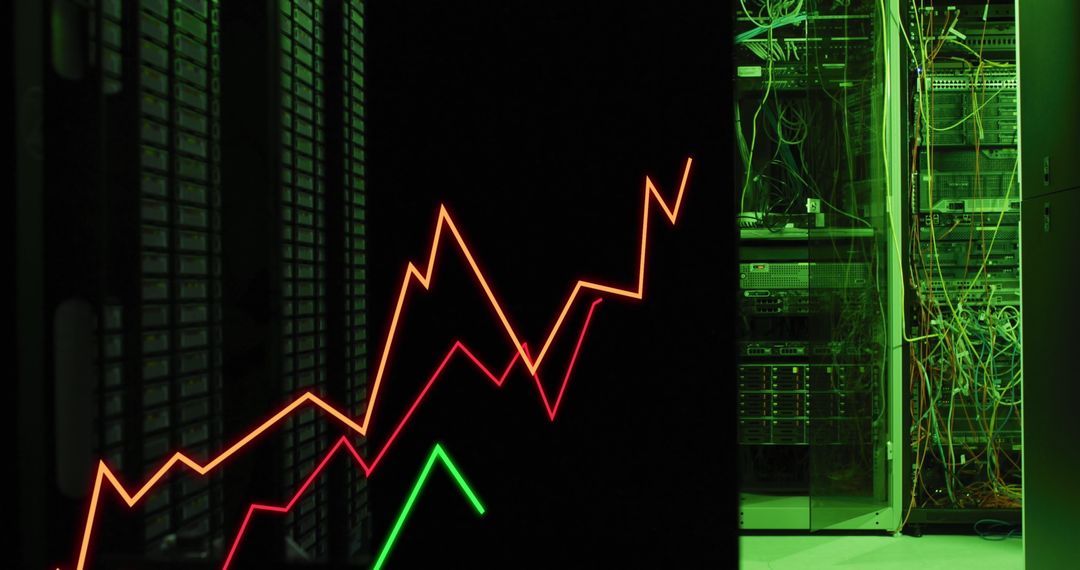
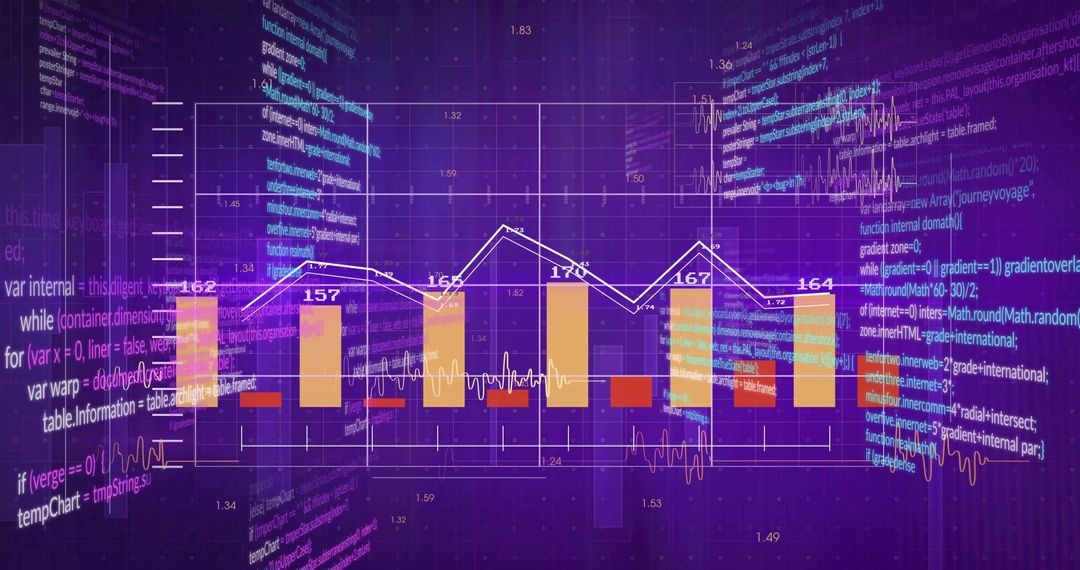
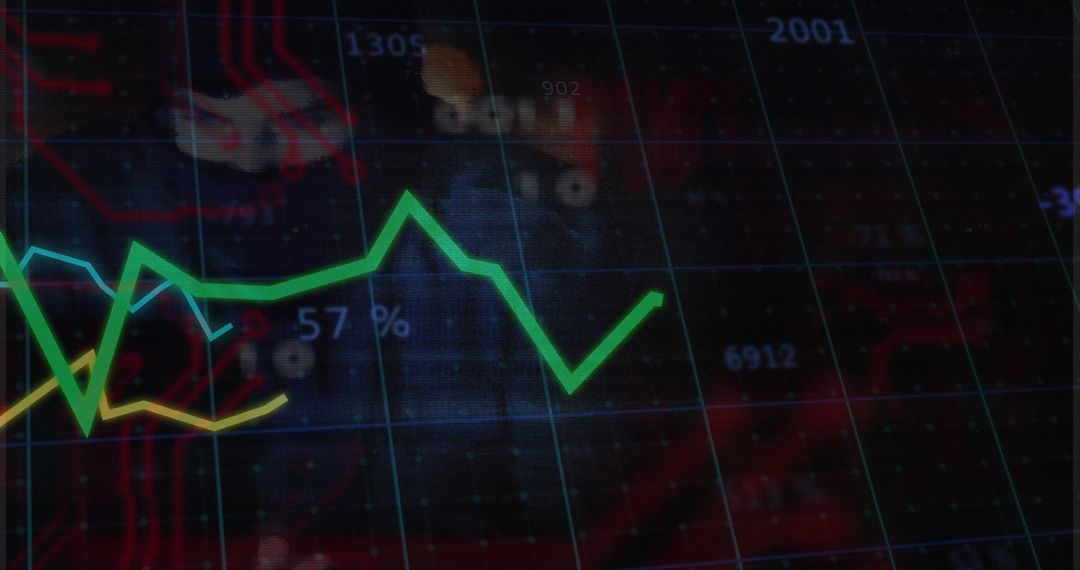
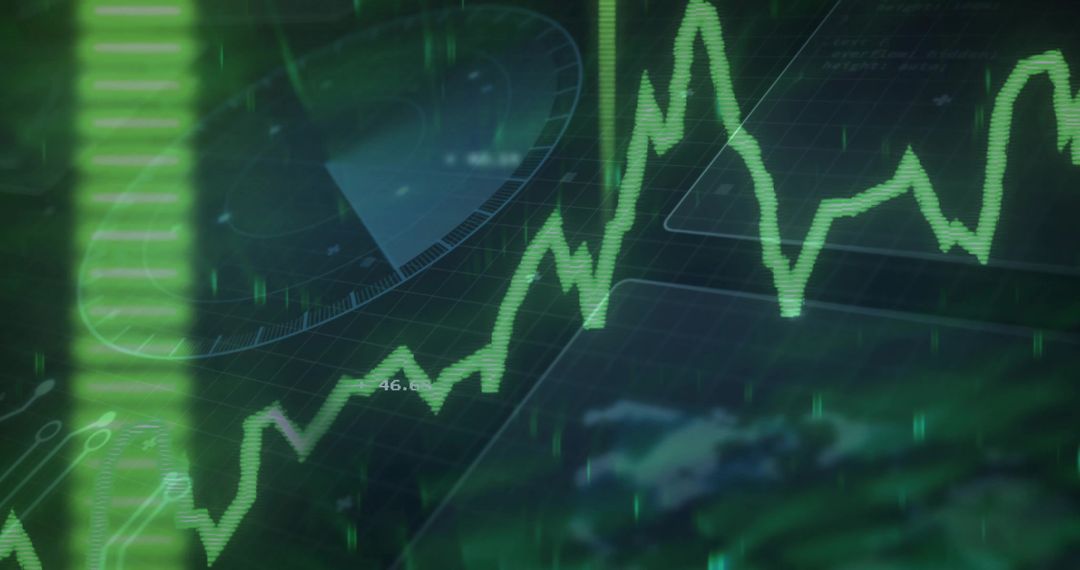
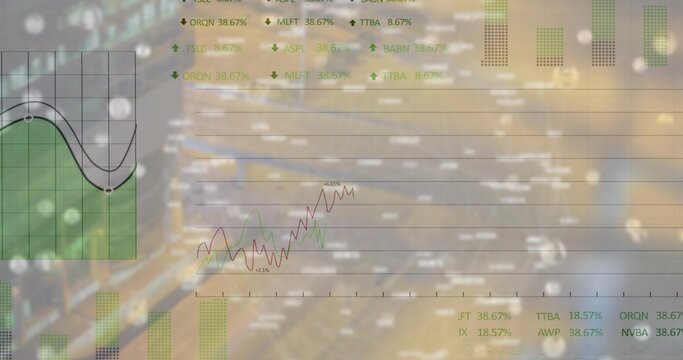
Featuring datacenter server racks with neon green LEDs overlaid by multi-colored line and bar charts showing financial metrics and percentages. Color palette focusing on blue and green neon tones creating futuristic tech mood. Ideal for fintech websites, trading platform headers, investor presentations, annual reports, cybersecurity and cloud service marketing, startup pitch decks, and editorial articles about market data or infrastructure. Allowing designers to use as hero background, slide illustration, banner, social post, or trade show graphic with ample negative space for headline and CTA placement. High-contrast layers enabling easy placement of text and logos and suitable for print and digital use.
Powered by 


0
downloads
downloads
Tags:
More
Credit Photo
If you would like to credit the Photo, here are some ways you can do so
Text Link
photo Link
<span class="text-link">
<span>
<a target="_blank" href=https://pikwizard.com/photo/futuristic-finance-dashboard-overlaying-datacenter-racks-with-neon-charts-and-metrics/1540e4cd9b95c15963f7034f5307a032/>PikWizard</a>
</span>
</span>
<span class="image-link">
<span
style="margin: 0 0 20px 0; display: inline-block; vertical-align: middle; width: 100%;"
>
<a
target="_blank"
href="https://pikwizard.com/photo/futuristic-finance-dashboard-overlaying-datacenter-racks-with-neon-charts-and-metrics/1540e4cd9b95c15963f7034f5307a032/"
style="text-decoration: none; font-size: 10px; margin: 0;"
>
<img src="https://pikwizard.com/pw/medium/1540e4cd9b95c15963f7034f5307a032.jpg" style="margin: 0; width: 100%;" alt="" />
<p style="font-size: 12px; margin: 0;">PikWizard</p>
</a>
</span>
</span>
Free (free of charge)
Free for personal and commercial use.
Author: Awesome Content
Similar Free Stock Images

Premium


Premium


Premium