
- Home >
- Stock Photos >
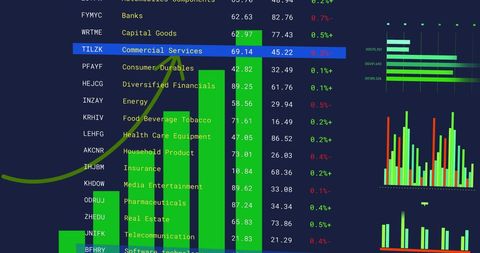
- Futuristic Finance Data with Digital Graph Elements
Futuristic Finance Data with Digital Graph Elements Image

Eye-catching representation of financial data processing with digital graph elements ideal for illustrating articles and presentations related to finance, global trade, digital networks, and financial analytics. Perfect for use in financial education materials, business reports, and economic trend analysis showcases.
Powered by 


downloads
Tags:
More
Credit Photo
If you would like to credit the Photo, here are some ways you can do so
Text Link
photo Link
<span class="text-link">
<span>
<a target="_blank" href=https://pikwizard.com/photo/futuristic-finance-data-with-digital-graph-elements/8cab35279a354ab0838c3e6159b0016d/>PikWizard</a>
</span>
</span>
<span class="image-link">
<span
style="margin: 0 0 20px 0; display: inline-block; vertical-align: middle; width: 100%;"
>
<a
target="_blank"
href="https://pikwizard.com/photo/futuristic-finance-data-with-digital-graph-elements/8cab35279a354ab0838c3e6159b0016d/"
style="text-decoration: none; font-size: 10px; margin: 0;"
>
<img src="https://pikwizard.com/pw/medium/8cab35279a354ab0838c3e6159b0016d.jpg" style="margin: 0; width: 100%;" alt="" />
<p style="font-size: 12px; margin: 0;">PikWizard</p>
</a>
</span>
</span>
Free (free of charge)
Free for personal and commercial use.
Author: Authentic Images
Similar Free Stock Images

Premium


Premium


AI


Premium

Premium


Premium


Premium


Premium


Premium

Premium


Premium


Premium


Premium


Premium

Premium


Premium


Premium


Premium

Premium


Premium

Premium


Premium


Premium


AI


Premium

Premium


Premium

Explore More Free Stock Images