
- Home >
- Stock Photos >
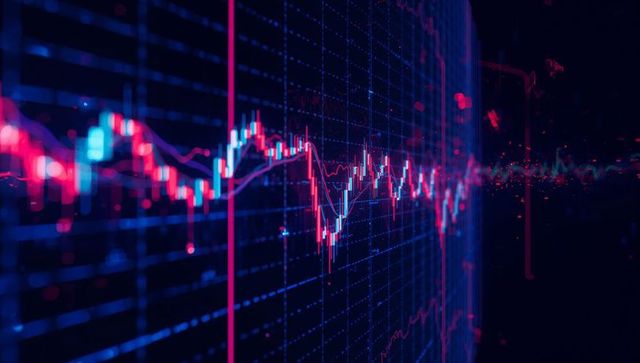
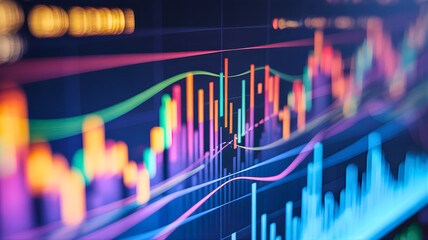
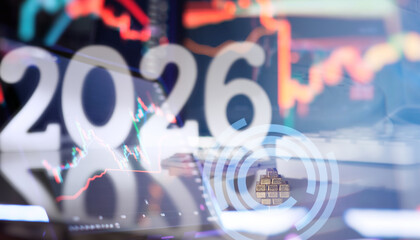
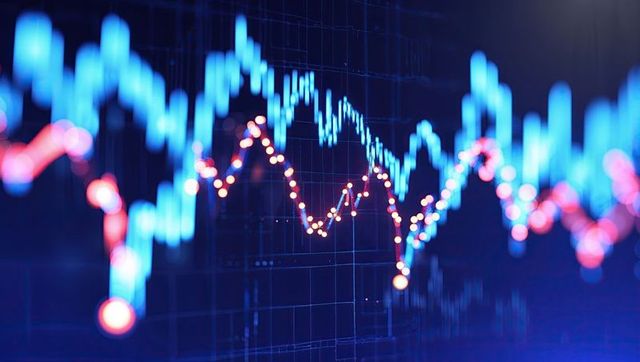
- Futuristic Finance Trading Graph with Interactive Data Visualization
Futuristic Finance Trading Graph with Interactive Data Visualization Image
AI
AI Generated Image. Digital visualization of market data, with highlighted candlestick patterns against vibrant backgrounds. Technological and analytic elements offer a futuristic look, complementing financial services and tech presentations. Ideal for financial reports, investment studies, promotional materials on fintech, or courses on digital finance.
Powered by 


downloads
Tags:
More
Credit Photo
If you would like to credit the Photo, here are some ways you can do so
Text Link
photo Link
<span class="text-link">
<span>
<a target="_blank" href=https://pikwizard.com/photo/futuristic-finance-trading-graph-with-interactive-data-visualization/ad9ad6e7eb43eed87604f5281cda22c6/>PikWizard</a>
</span>
</span>
<span class="image-link">
<span
style="margin: 0 0 20px 0; display: inline-block; vertical-align: middle; width: 100%;"
>
<a
target="_blank"
href="https://pikwizard.com/photo/futuristic-finance-trading-graph-with-interactive-data-visualization/ad9ad6e7eb43eed87604f5281cda22c6/"
style="text-decoration: none; font-size: 10px; margin: 0;"
>
<img src="https://pikwizard.com/pw/medium/ad9ad6e7eb43eed87604f5281cda22c6.jpg" style="margin: 0; width: 100%;" alt="" />
<p style="font-size: 12px; margin: 0;">PikWizard</p>
</a>
</span>
</span>
Free (free of charge)
Free for personal and commercial use.
Author: AI Creator
Similar Free Stock Images

Premium


Premium

Premium


Premium


Premium

Premium


Premium


Premium


Premium

Premium


Premium


Premium

Premium

Premium

AI


Premium


Premium


Premium


AI


AI
Premium


Premium


Premium


Premium


Premium


Premium


AI

AI
Premium


Premium

Explore More Free Stock Images