- Home >
- Stock Photos >
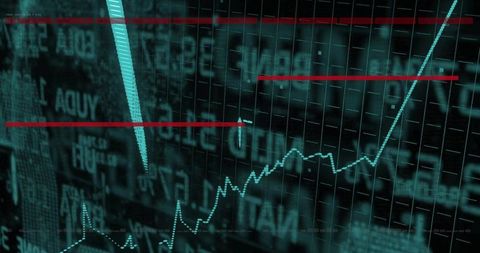
- Futuristic Financial Analytics with Binary Code Overlay
Futuristic Financial Analytics with Binary Code Overlay Image

Visual of binary code overlaying rising stock or financial graph. Deep red illustrations suggest themes of cybersecurity and advanced technology. Useful for showcasing articles or materials on financial growth trends, data strategy, or tech-centric market analysis. Suitable for tech, cybersecurity, trading, or finance-themed visuals exploring digital advancements.

downloads
Tags:
More
Credit Photo
If you would like to credit the Photo, here are some ways you can do so
Text Link
photo Link
<span class="text-link">
<span>
<a target="_blank" href=https://pikwizard.com/photo/futuristic-financial-analytics-with-binary-code-overlay/405fd5ce7e7f3c6a5bb87491d93d7b5a/>PikWizard</a>
</span>
</span>
<span class="image-link">
<span
style="margin: 0 0 20px 0; display: inline-block; vertical-align: middle; width: 100%;"
>
<a
target="_blank"
href="https://pikwizard.com/photo/futuristic-financial-analytics-with-binary-code-overlay/405fd5ce7e7f3c6a5bb87491d93d7b5a/"
style="text-decoration: none; font-size: 10px; margin: 0;"
>
<img src="https://pikwizard.com/pw/medium/405fd5ce7e7f3c6a5bb87491d93d7b5a.jpg" style="margin: 0; width: 100%;" alt="" />
<p style="font-size: 12px; margin: 0;">PikWizard</p>
</a>
</span>
</span>
Free (free of charge)
Free for personal and commercial use.
Author: Creative Art