- Home >
- Stock Photos >
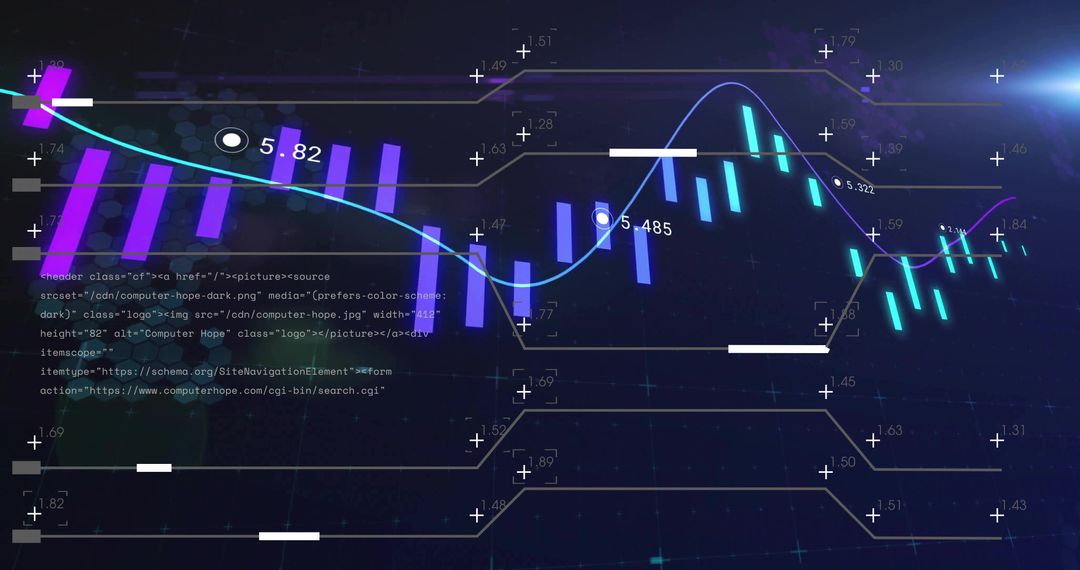
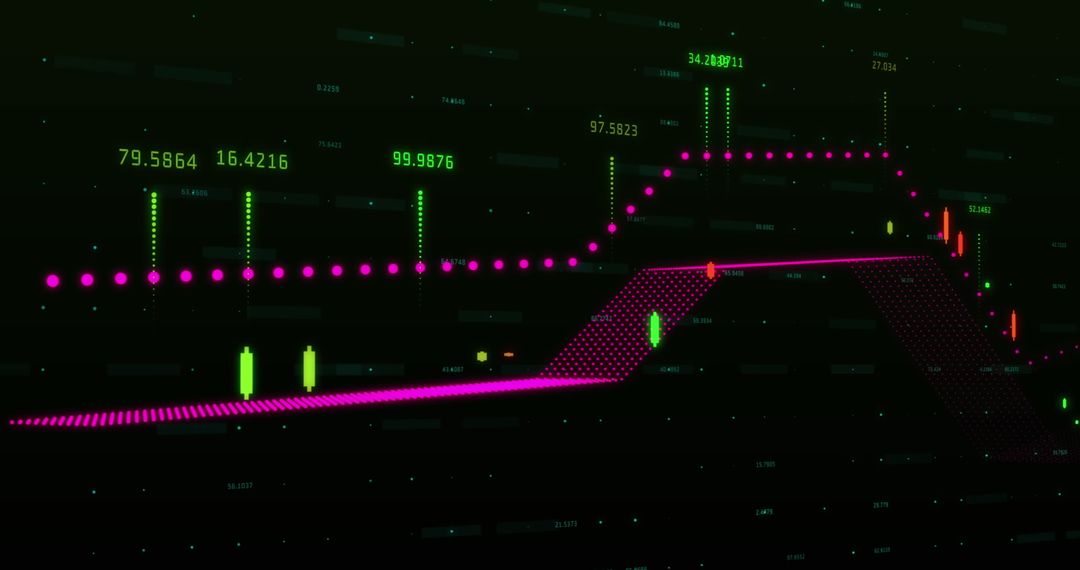
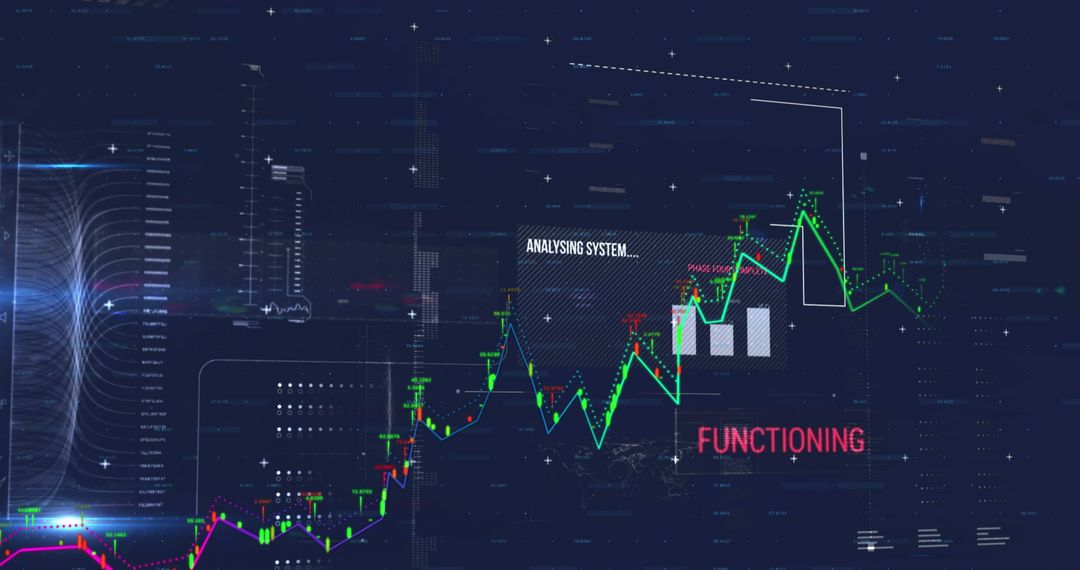
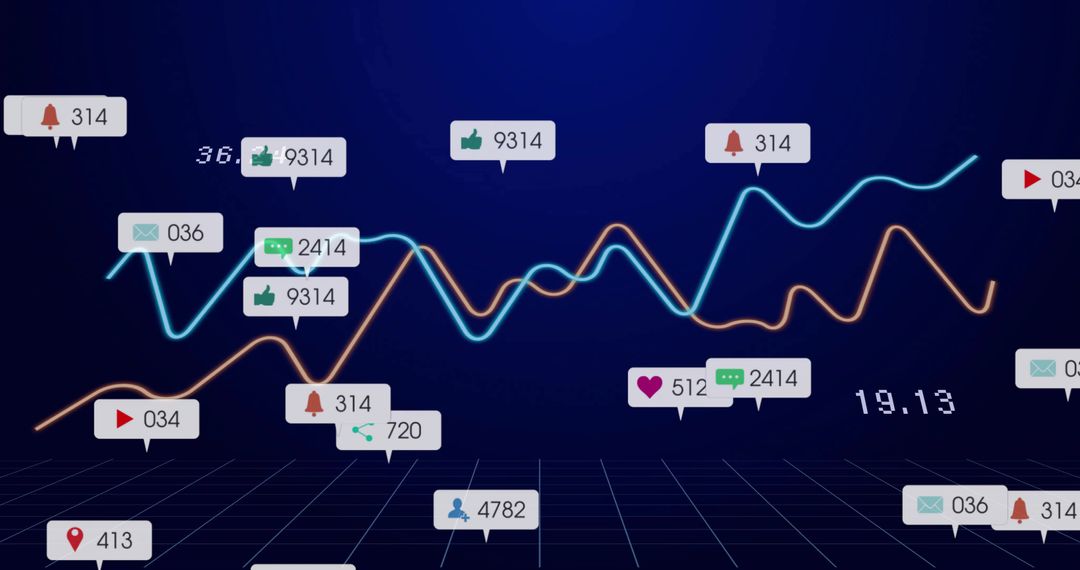
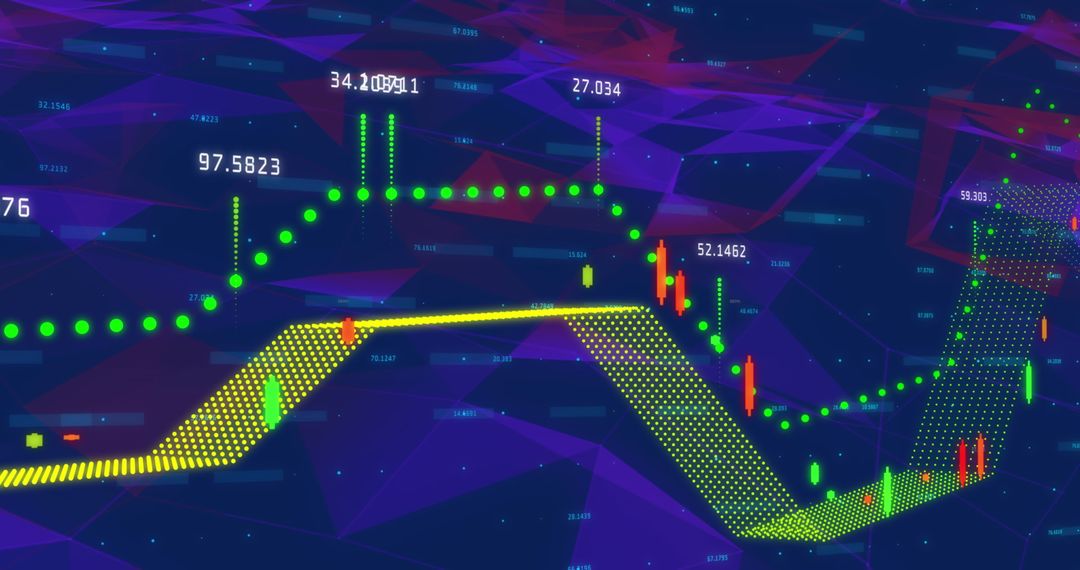
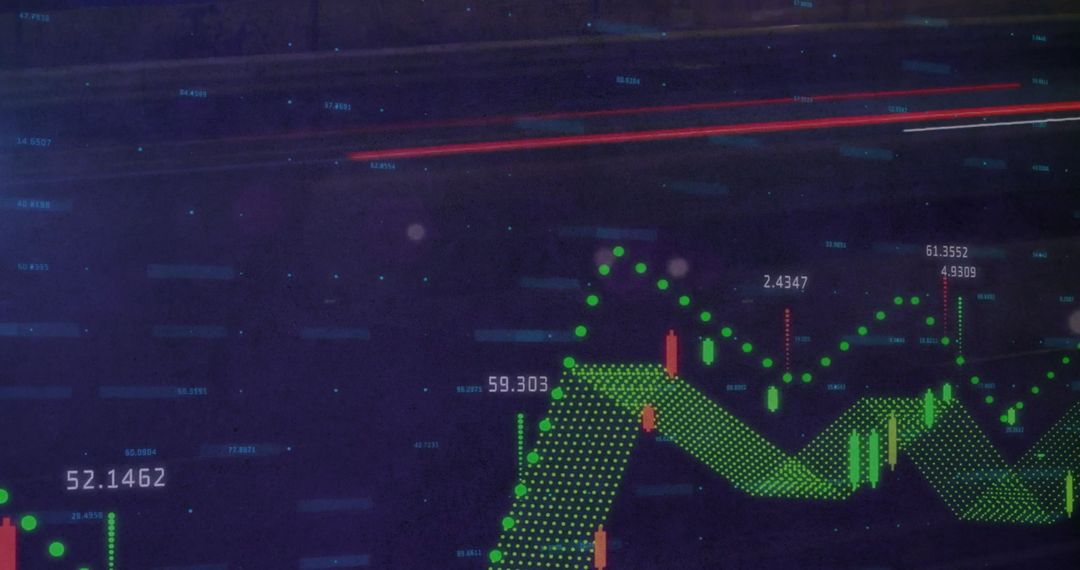
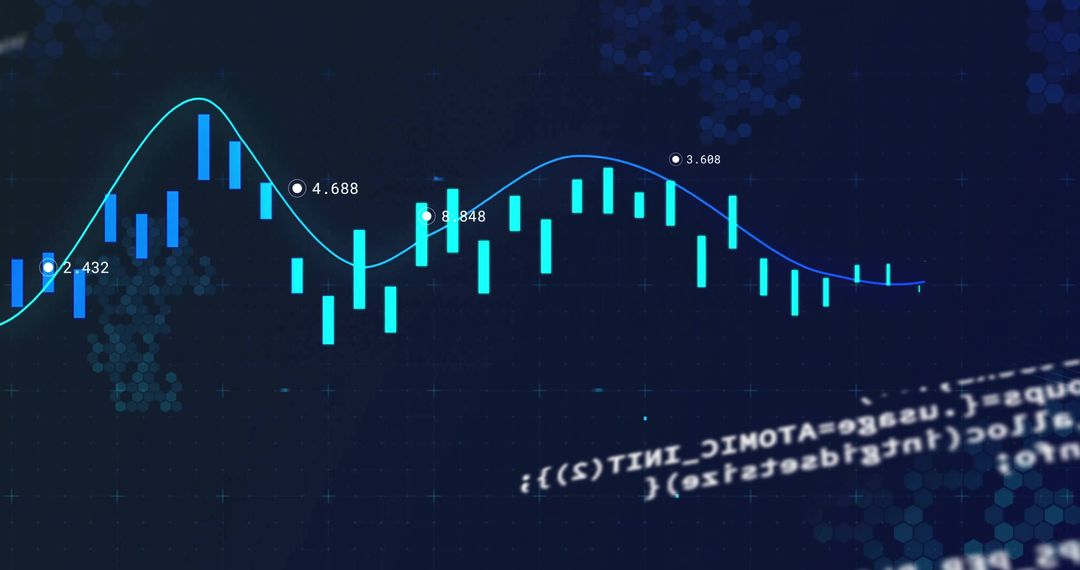
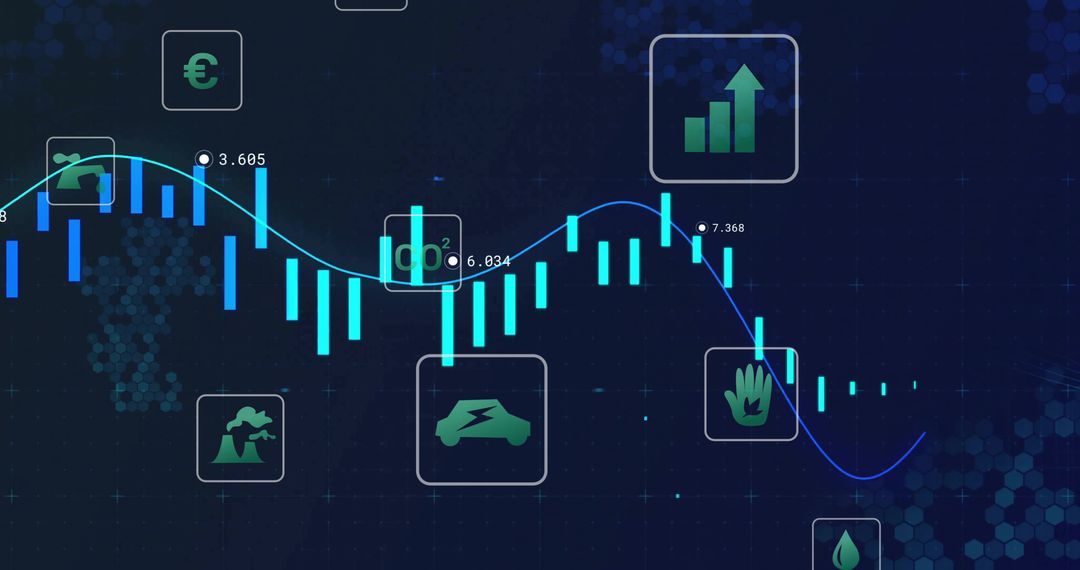
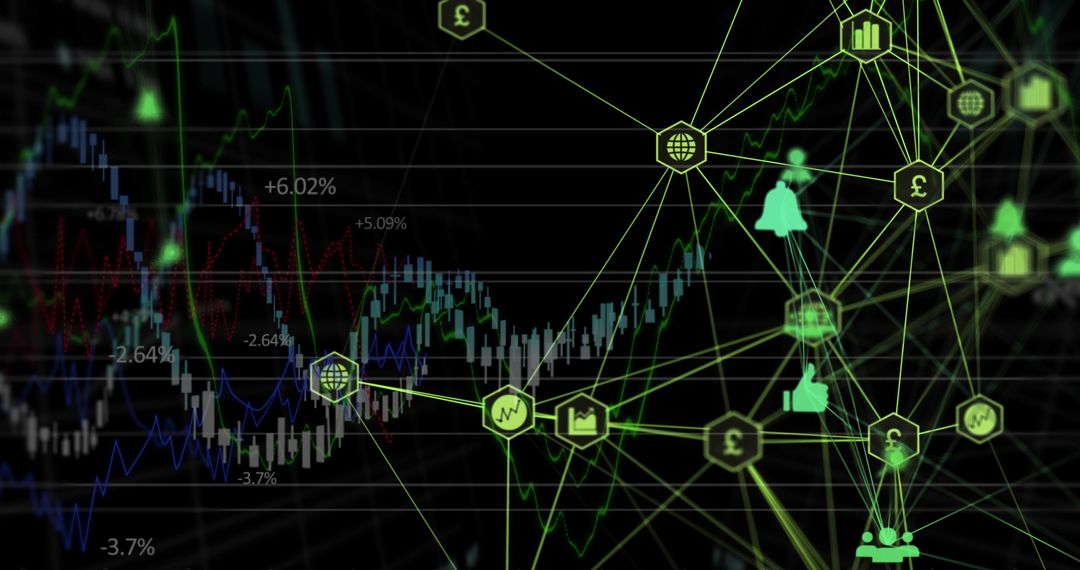
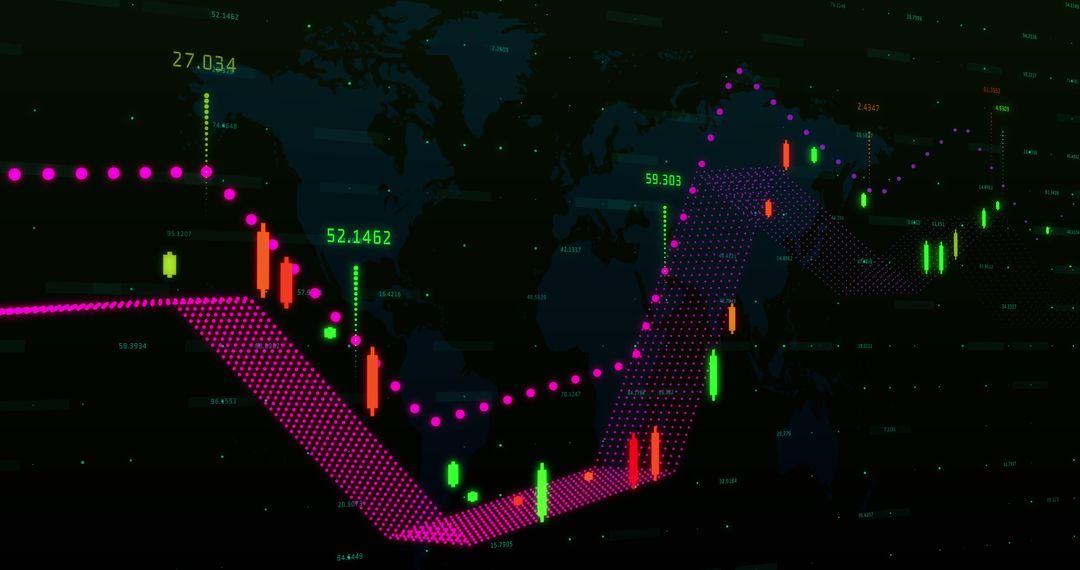
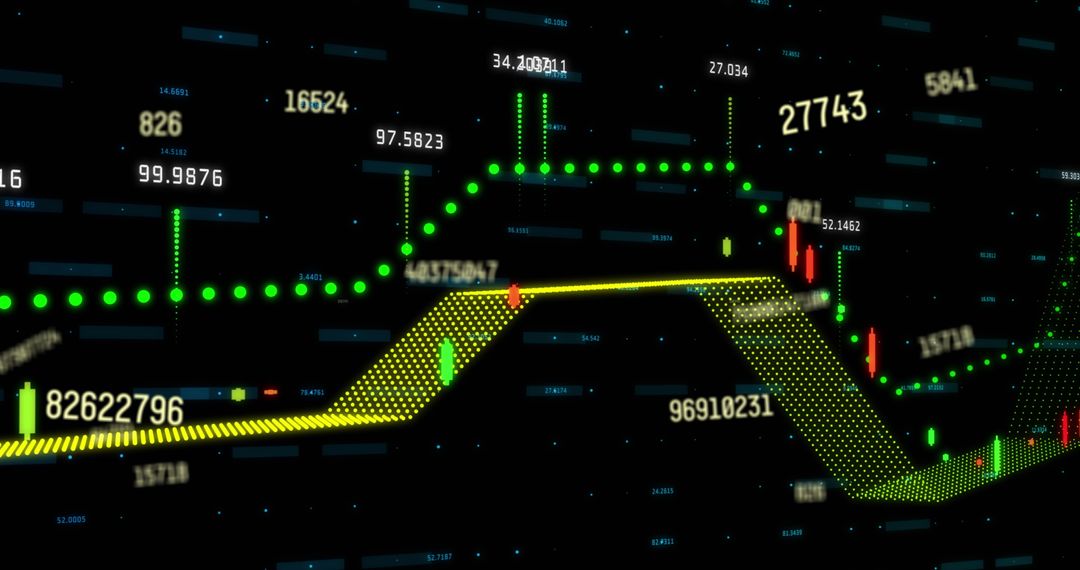
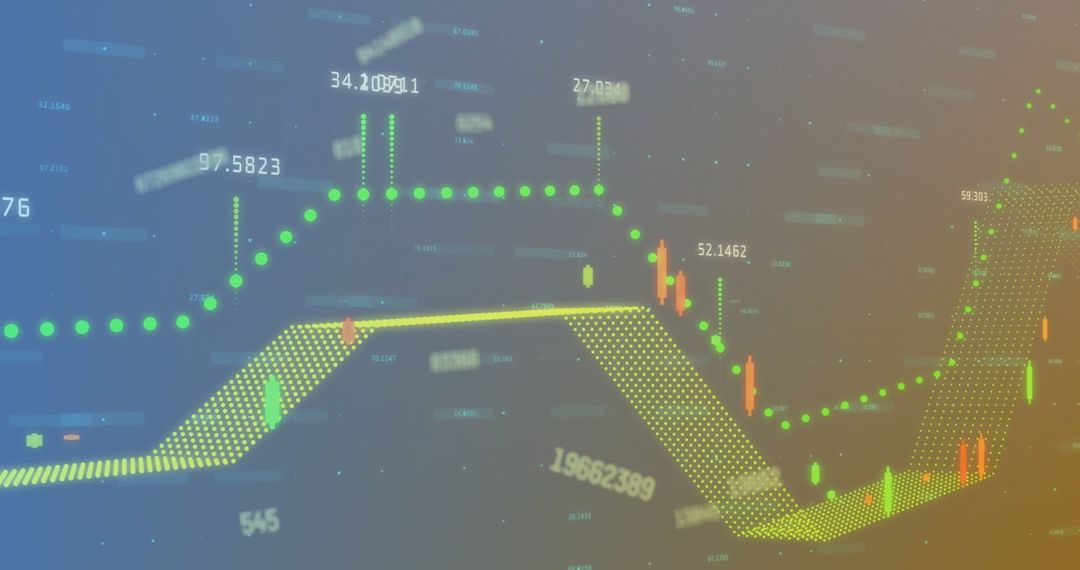
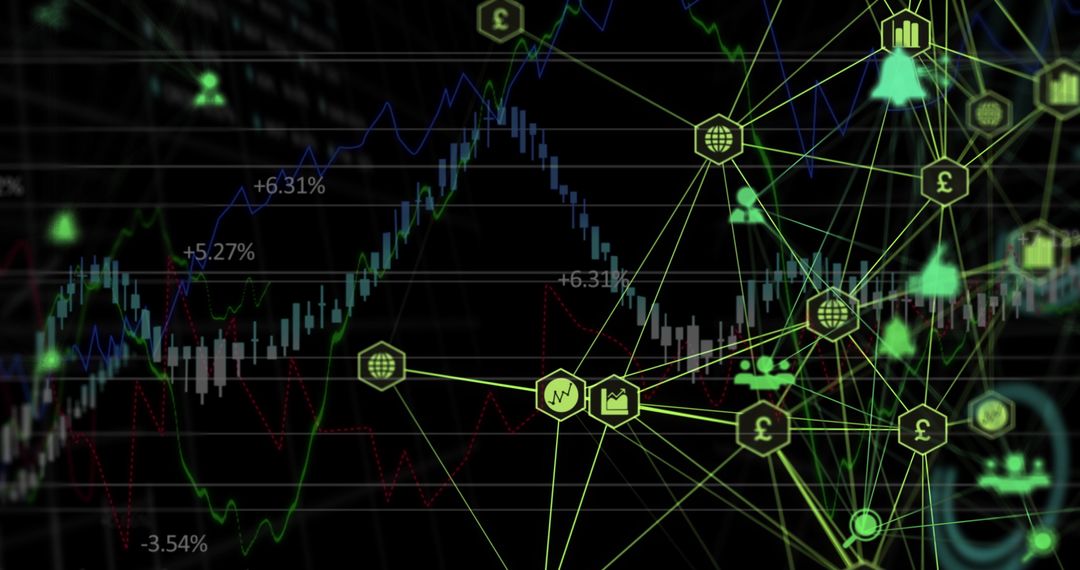
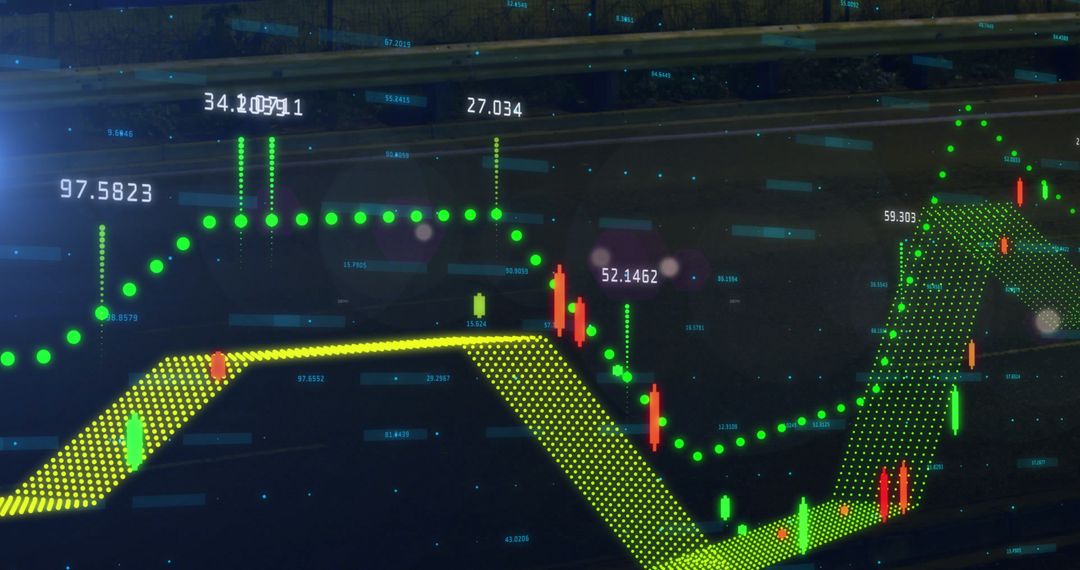
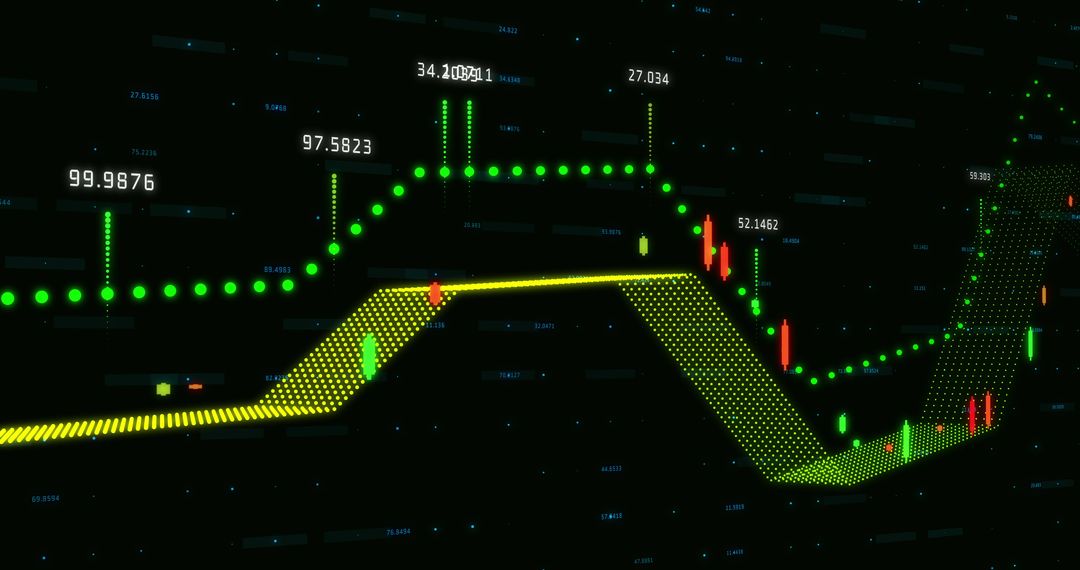
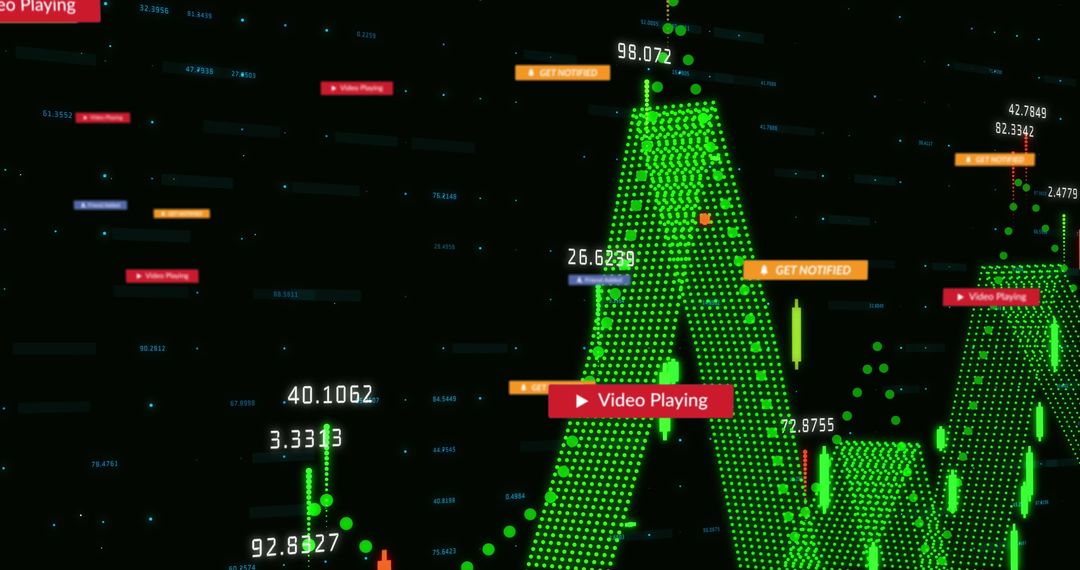
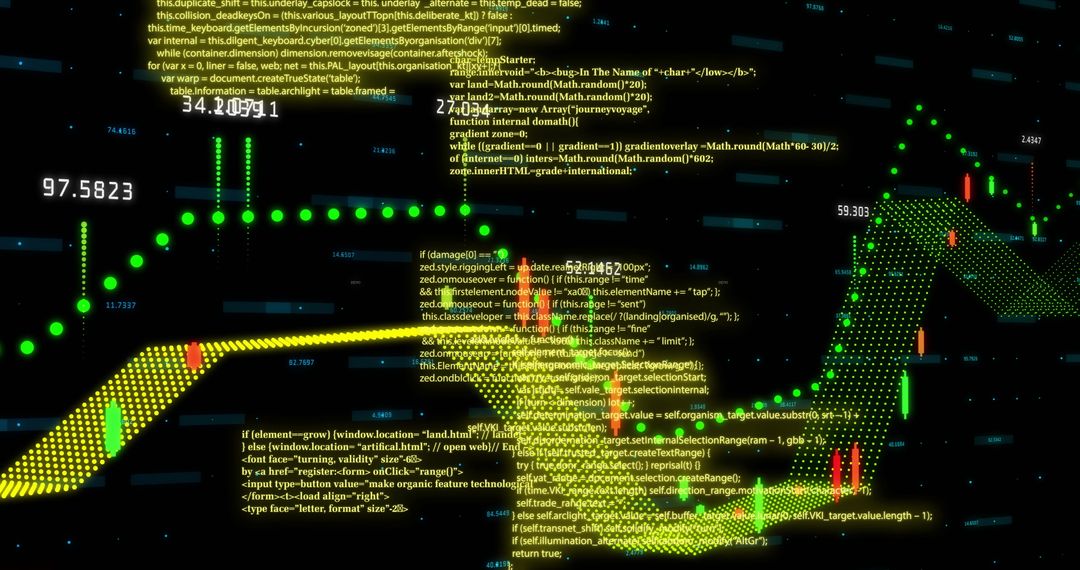
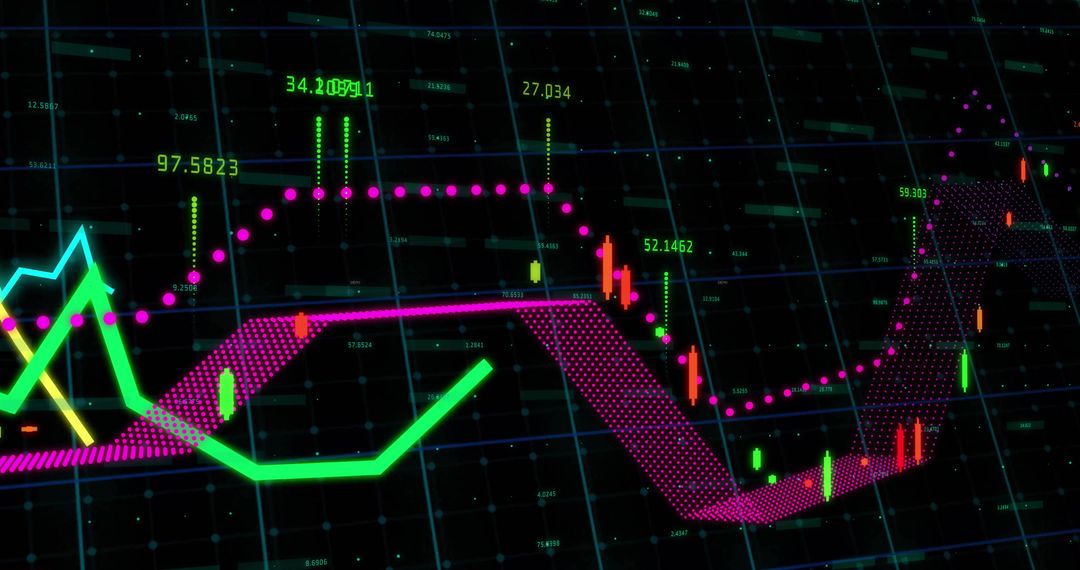
- Futuristic Financial Dashboard Showing Candlestick Trends, Dotted Ribbon Path and Alerts
Futuristic Financial Dashboard Showing Candlestick Trends, Dotted Ribbon Path and Alerts Image

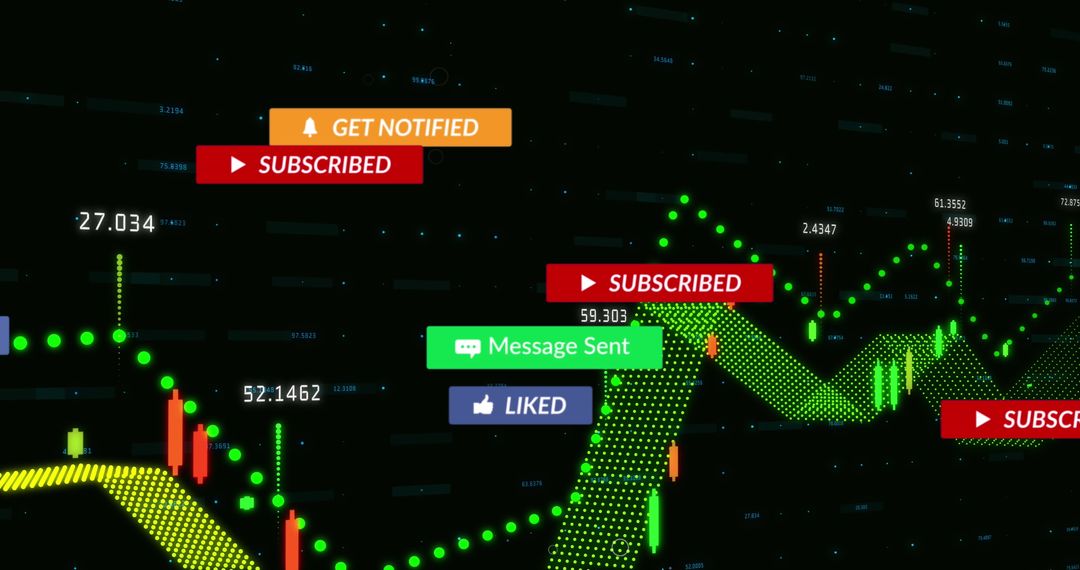
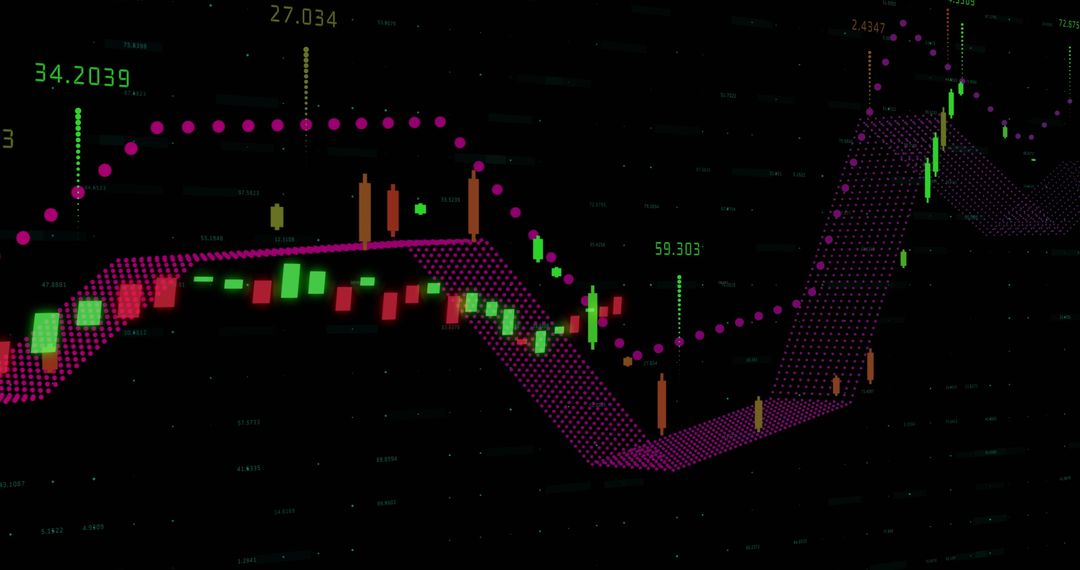
Showing dynamic candlestick data overlaid with dotted ribbon path and glowing trend line. Featuring neon green dot series, yellow dotted band, red and green candlestick bars, orange notification badge and translucent tooltips on dark navy grid. Conveying futuristic, high-tech analytics and real-time monitoring for finance and trading contexts. Suited for fintech marketing, trading platform landing pages, investor reports, pitch decks, webinar slides, blog headers and social media campaigns. Working well as hero visual for app UI mockups, explainer video backgrounds, UX design showcases and data-driven presentations. Pairing effectively with bold typography, numeric callouts and animated transitions to illustrate market movement, volatility, alert systems and algorithmic trading concepts.
Powered by  - Get 15% off with code: PIKWIZARD15


0
downloads
downloads
Tags:
More
Credit Photo
If you would like to credit the Photo, here are some ways you can do so
Text Link
photo Link
<span class="text-link">
<span>
<a target="_blank" href=https://pikwizard.com/photo/futuristic-financial-dashboard-showing-candlestick-trends-dotted-ribbon-path-and-alerts/84a82df4fd7c0afba3c7efb796810398/>PikWizard</a>
</span>
</span>
<span class="image-link">
<span
style="margin: 0 0 20px 0; display: inline-block; vertical-align: middle; width: 100%;"
>
<a
target="_blank"
href="https://pikwizard.com/photo/futuristic-financial-dashboard-showing-candlestick-trends-dotted-ribbon-path-and-alerts/84a82df4fd7c0afba3c7efb796810398/"
style="text-decoration: none; font-size: 10px; margin: 0;"
>
<img src="https://pikwizard.com/pw/medium/84a82df4fd7c0afba3c7efb796810398.jpg" style="margin: 0; width: 100%;" alt="" />
<p style="font-size: 12px; margin: 0;">PikWizard</p>
</a>
</span>
</span>
Free (free of charge)
Free for personal and commercial use.
Author: Authentic Images
Similar Free Stock Images
Premium


Premium


Premium


Premium


Premium


Premium


Premium


Premium


Premium


Premium
Premium


Premium


Premium


Premium


Premium


Premium

Premium


Premium


Premium

Premium


Premium


Premium


Premium


Premium