1. Home > 
  2. Stock Photos > 
  3. Futuristic Financial Data Analysis and Coding Visualization

Futuristic Financial Data Analysis and Coding Visualization Image

Futuristic Financial Data Analysis and Coding Visualization

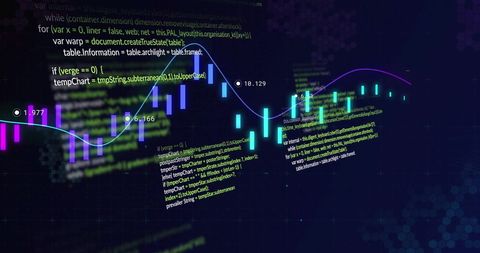
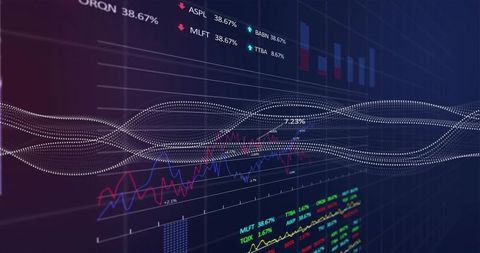
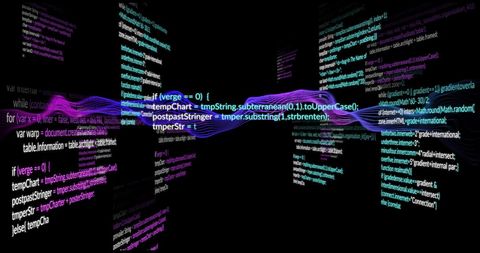
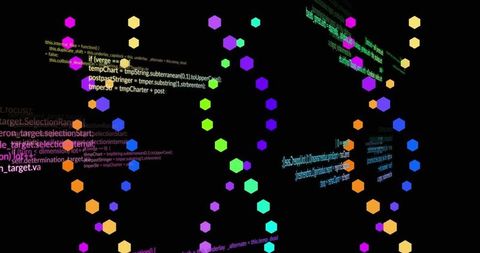
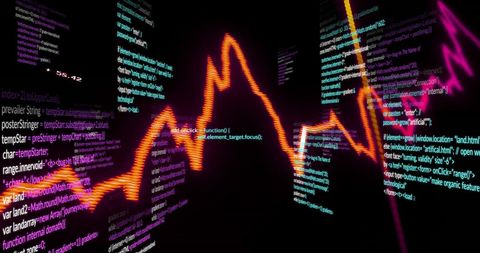
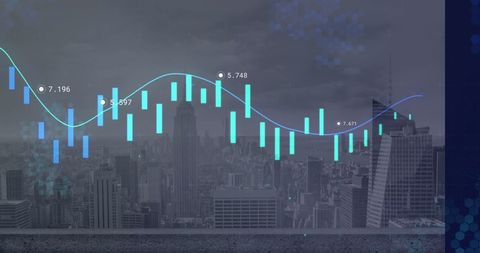
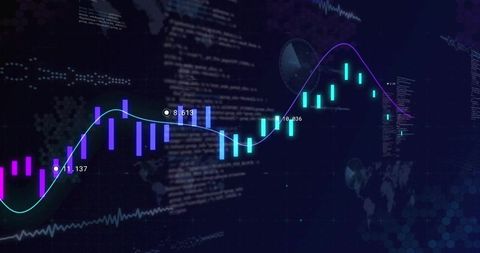
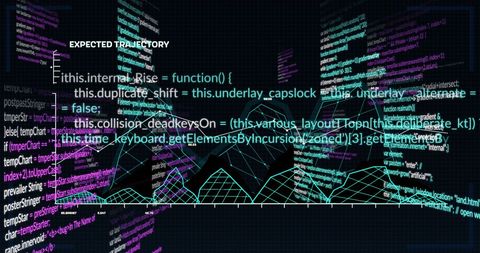
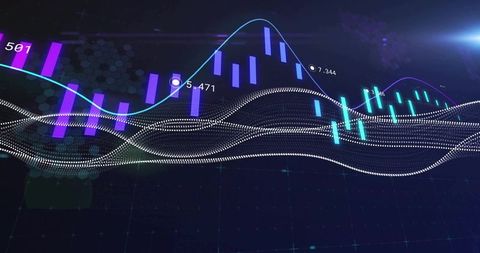
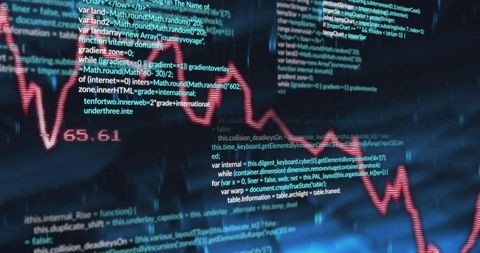
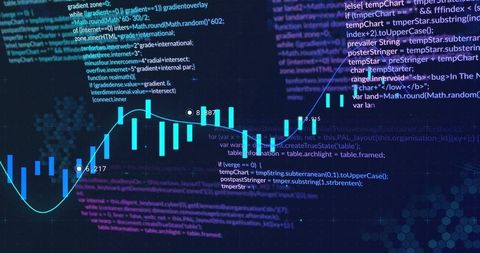
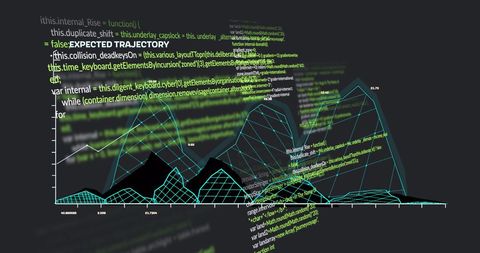
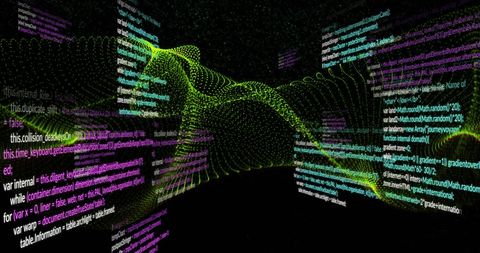
The image combines elements of financial data and coding with a futuristic aesthetic featuring a glowing line graph overlaying stock market information. It captures the essence of advanced analytics in finance, showcasing the integration of technology and data concepts. Ideal for use in websites or materials related to financial technology, hacking, digital trading, or data science promotions and representations.

Powered by Shutterstock logo - Get 15% off with code: PIKWIZARD15
Close-up of financial chart on stock market on monitor display. Stock market data business analysis concept. - Powered by Shutterstock - Get 15% off with code: PIKWIZARD15Displaying digital globe streaming binary code over corporate façade, with stock tickers. Data visualization, financial technology, corporate architecture, digital innovation, market analysis, - Powered by Shutterstock - Get 15% off with code: PIKWIZARD15Financial stock market analysis and technology abstract background. Digital software development and computer code, economic graph on virtual screen - Powered by Shutterstock - Get 15% off with code: PIKWIZARD15Displaying screen showing financial ticker symbols and JavaScript code in office, with grid lines. Finance, technology, data visualization, analytics, coding, digital interface, financial industry - Powered by Shutterstock - Get 15% off with code: PIKWIZARD15Analyzing Stock Market Data Using Modern Technology - Powered by Shutterstock - Get 15% off with code: PIKWIZARD15

Credit Photo

If you would like to credit the Photo, here are some ways you can do so

Free (free of charge)

Free for personal and commercial use.

Author: Awesome Content

Similar Free Stock Images

Interactive Market Analytics Dashboard Showing Candlestick Bars and Smooth Trend Line
Premium
Stock market numbers and percentages are displaying on electronic boards. Glowing green digits show various stock codes and values, reflecting financial activity
Data Processing with Digital Interface and Code Background
Premium
 number,data background,business concept
Premium
Displaying LED data display board at trading office, showing alphanumeric codes and colored metrics. Technology, analytics, dashboard, enterprise, futuristic, precision, information
Dynamic Statistical Data Analysis on Digital Grid Network
Dynamic Financial Data Visualization with Digital Code
Financial Data Processing Code Over Digital Graph
Futuristic Waveform Display on Virtual Trading Dashboard
Premium
Stock market price digital display abstract. Modern virtual technology, illustration binary code on abstract technology background. Media gray and black image with graphs and icons. Shallow DOF effect
Social Media Alerts Overlaying Financial Market Trends
Futuristic JavaScript Coding with Neon Waveforms
Digital Financial Data Processing with Trend Lines
Digital Data Processing Over Neural Network Mesh
Premium
Financial data of stock market in term of a digital prices on LED display. A number of daily market price and quotation of prices chart to represent candle stick tracking in Forex trading.
Futuristic Financial Dashboard Showing Candlestick Trends, Dotted Ribbon Path and Alerts
Dynamic Financial Data Analysis on Dark Background
Neon Data Analytics Screen with Real-Time Notifier Widgets
Dynamic Financial Chart with Blue and Purple Indicators
Premium
Woman in business attire tracking live stock ticker overlay in modern office, market analysis theme. Finance, technology, data, analytics, professional, digital, corporate
Data Processing and Analysis Visualization on Black Background
Digital Finance Data Overload with Code and Graphs
Futuristic Wave Overlaying Colorful Programming Code on Dark Background
Digital Financial Data Display with Graphs and Metrics
Abstract Data Visualization with Neon Waveforms
Futuristic Digital Data Visualization with Blue Waveforms
Digital Data Processing Overlay with Graphs and Charts
Global Network Visualization with Programming Language Overlay
Premium
The market volatility of crypto trading with technical price graph and indicator, red and green candlesticks, for analysis up and downtrend. Stock trading, crypto currency background concept.
Premium
Displaying central digital overlay with stock tickers and percentages over meadow, translucent logo. Finance, technology, innovation, investment, data, analytics, digital
Digital Head and Data Visualization in Futuristic Grid
Digital Interface with Data Streams and Stock Market Elements
Dynamic Financial Market Data and Business Technology Concept
Data Analysis and Graphs Displaying Stock Market Trends
Digital Financial Graphs and Market Data Analysis
Digital DNA Visualization with Coding Elements in Spectrum of Colors
Dynamic Stock Market Data Visualizing Global Economic Trends
Premium
Displaying digital dashboard at trading interface, showing ticker codes, percentages, data graphs. Technology, analytics, data visualization, financial, modern, corporate, interface
Premium
Displaying alphanumeric codes and percentage values on financial trading screen with blue circle. Technology, cybersecurity, data visualization, analytics, digital, futuristic, innovation
Premium
Standing woman in white blouse monitoring stocks on transparent ticker in modern office. Corporate, finance, workspace, technology, professional, data, analytics
Abstract Financial Market Data with CGI and Code Overlay
Digital Head Silhouette with Code Representing AI Technology
Digital Financial Chart Over Cityscape Backdrop
Financial Data Over Cityscape with Glowing Graph Lines
Pulsing Red Line Graph Sweeping Over Source Code Dashboard Showing Readout 65.61
Futuristic Data Analytics with Graphs and Charts
Digital Data Analysis Abstract Background with Graphs
Abstract Global Network and Data Interface Design
Premium
Displaying financial screen scrolling stock ticker symbols in trading floor, with highlight circles. Technology, finance, data visualization, analytics, investment, market, digital
Asian Male IT Technician Monitoring Data Systems
Abstract Digital Head with Code Overlays Highlighting Data Processing
Abstract Financial Data and Globalization Symbols Simulation
Abstract Financial Data with Neon Line Graph and Candlestick Chart
Digital Data Processing with Code and Graphs on Black Background
Digital Financial Graph in Modern Office Setting
Abstract Digital Data and Financial Symbols Network
Premium
Displaying trading screen showing ticker codes, percentages on dark 3D grid, with light-blue curves. Technology, finance, analytics, futuristic, data visualization, digital, innovation
Futuristic Digital Network with Code Elements and Globe Hologram
Artificial Intelligence Head with Data Visualization Overlay
Digital Financial Data Analysis with Chart and Markers
Digital Dashboard With Candlestick Bar and Line Graph Interface
Digital Financial Graph and City Silhouette Backdrop
Financial Data Processing Over Digital Grid with Code Elements
Futuristic Interface with Digital Green Text and Grid
Visualizing Financial Data Trends Over Urban Backdrop
Premium
Digital ticker display showing ticker codes with colored percent changes at trading floor. Technology, finance, data visualization, investment, analytics, futuristic, digital
Data Processing Visualization with Cityscape Background
Futuristic AI Concept with Digital Code Layering Human Silhouette
Digital Interface and Coding with Data Flow Diagrams
Futuristic Financial Graph with Candlesticks and Wave Line
Futuristic Global Financial Data Analysis Background
Digital Financial Data Processing on Circuit Board
Digital Financial Data Over Cityscape Representation
Futuristic Trading and Data Analysis Platform with Trend Visualizations
Global Business Data Analytics on World Map
Dynamic Notification Interface with Stocks and Social Media Alerts
Digital Financial Data Visualization in Dark Space
Futuristic AI Chat Interface with Data Diagrams
Digital Analytics Display with Candlestick Graph and User Engagement
Premium
Displaying multicolored bars, red turquoise line graphs on screen, with streaming binary digits. Data visualization, financial analytics, digital interface, cyber security, technology, futuristic,
Like Counter with Data Visualizations and Digital Interface Elements
Digital Data Processing with Graphs and Coding Visualization
City Skyline with Digital Graph Representing Market Trends
Glowing Code Editor Under Neon Green Grid Overlay with Syntax Highlighting and Waveform
Premium
Financial data of stock market in term of a digital prices on LED display. A number of daily market price and quotation of prices chart to represent candle stick tracking in Forex trading.
Premium
Financial data of stock market in term of a digital prices on LED display. A number of daily market price and quotation of prices chart to represent candle stick tracking in Forex trading.
Financial Analysis with Digital Data and Vibrant Graph
Digital Stock Market Data with Graphs and Numbers in Hologram Style
Displaying Neon Candlestick Chart with Smooth Trend Lines and Numeric Labels
Dynamic Stock Market Chart Overlay with Financial Data Visuals
Premium
Coding and business. Computer source code and stock graph chart on monitor screen. Modern Internet web technology and business financial background photo.
Abstract Financial Graph with Data Points over Digital Background
Financial Data Analytics Over Urban Skyline Backdrop
Neon Green Neural Circuit Tree on Digital Code Grid Representing AI Network and Data Flow
Digital Healthcare Data Visualization with Virus Cells During Pandemic
Futuristic Data Visualization with Highlighted Analytics Trends
Financial Data Analysis with Code Interface on Black Background
Dynamic Data Processing with Digital Interface
Data Processing Visual with Technical Elements
Abstract Data Visualization with Dynamic Coding and Analytics
Analyzing Data Trends with Futuristic Graph Interface
Global Data Processing and Analytics on Dark Background
JavaScript Code Display with Digital Media Icons Overlay
Data Processing Overlaid on Graphs and Code in Digital Interface
Colorful Code Transparent Over Data Waves Representation
Premium
Market data streaming above fireplace, with line chart, tickers, binary, glowing embers, figurines. Financial visualization, data analytics, technology, business intelligence, digital art, corporate,
Premium
Financial data of stock market in term of a digital prices on LED display. A number of daily market price and quotation of prices chart to represent candle stick tracking in Forex trading.
Premium
Software development. Programming code abstract technology background and Stock market digital graph chart LED display concept. Indicator financial trade education development coding code program.
Digital Coding and Financial Stock Market Graph Analysis
Futuristic Digital Data with Neon 3D Bar Charts and Blue Waveforms
Animated Financial Graph with Candlestick Chart
Digital Analytics Over Cityscape at Night
Premium
Financial data of stock market in term of a digital prices on LED display. A number of daily market price and quotation of prices chart to represent candle stick tracking in Forex trading.
Futuristic Finance Interface and Software Analytics Visualization
Neon Candlestick Chart with Codes and Data Visualization Concept
Abstract Financial Data Chart Over Urban Skyline
Holographic Code Stream Visualizing Real-Time Data Analytics on Neon Grid
Premium
Financial data of stock market in term of a digital prices on LED display. A number of daily market price and quotation of prices chart to represent candle stick tracking in Forex trading.
Stock Market Graphs Displaying Financial Analytics
Premium
Financial cryptocurrency coin for trading in money exchange market. Top of digital currency which including of Bitcoin(BT) and Ethereum coin(ETC).
Digital Data Streams and Code on Black Background
Digital Representation of Financial Data Trends
Global Economic Trends Overlapping Environmental Issues
Digital Head and Data Processing on Futuristic Interface
Premium
Displaying trading board showing currency and stock tickers in trading room, with arrow indicators. Finance, technology, analytics, data, dashboard, investment, digital
Explore More Free Stock Images