- Home >
- Stock Photos >
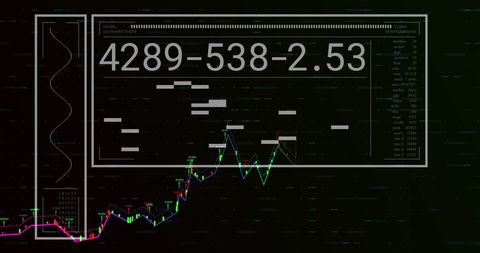
- Futuristic Financial Data Analysis with Rising Stock Chart
Futuristic Financial Data Analysis with Rising Stock Chart Image

Futuristic interface illustrating financial data processing with a highlighted rising stock chart. Ideal for use in articles and presentations about investment strategies, technology in finance, market predictions, and global economic trends.

downloads
Tags:
More
Credit Photo
If you would like to credit the Photo, here are some ways you can do so
Text Link
photo Link
<span class="text-link">
<span>
<a target="_blank" href=https://pikwizard.com/photo/futuristic-financial-data-analysis-with-rising-stock-chart/b69bdd4d13feced71a4aaab58b07eee1/>PikWizard</a>
</span>
</span>
<span class="image-link">
<span
style="margin: 0 0 20px 0; display: inline-block; vertical-align: middle; width: 100%;"
>
<a
target="_blank"
href="https://pikwizard.com/photo/futuristic-financial-data-analysis-with-rising-stock-chart/b69bdd4d13feced71a4aaab58b07eee1/"
style="text-decoration: none; font-size: 10px; margin: 0;"
>
<img src="https://pikwizard.com/pw/medium/b69bdd4d13feced71a4aaab58b07eee1.jpg" style="margin: 0; width: 100%;" alt="" />
<p style="font-size: 12px; margin: 0;">PikWizard</p>
</a>
</span>
</span>
Free (free of charge)
Free for personal and commercial use.
Author: People Creations