
- Home >
- Stock Photos >
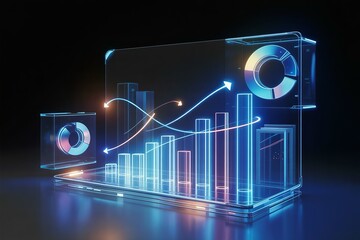
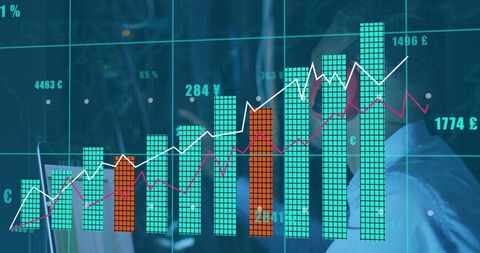
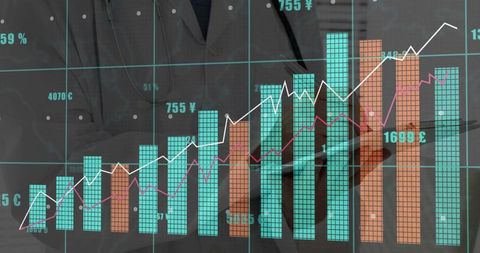
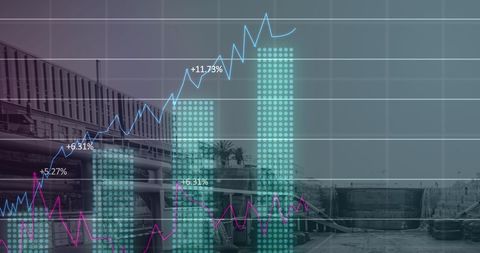
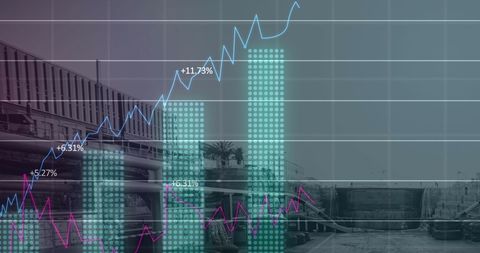
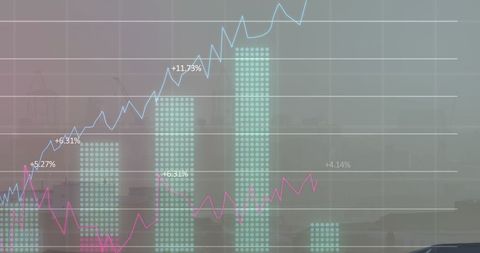
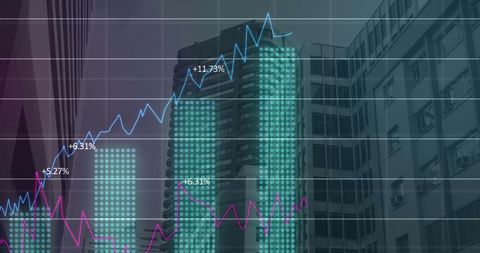
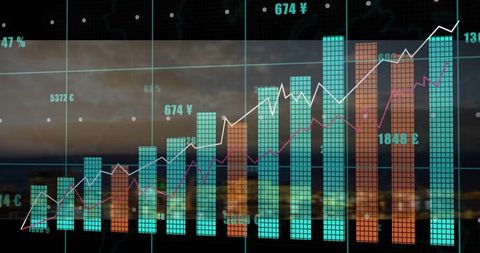
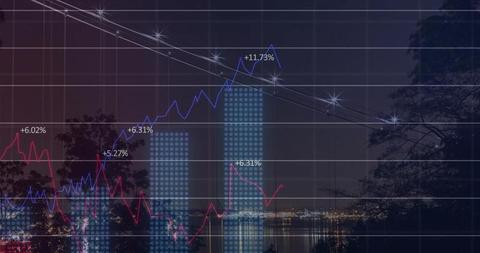
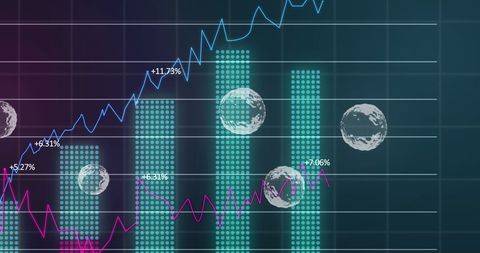
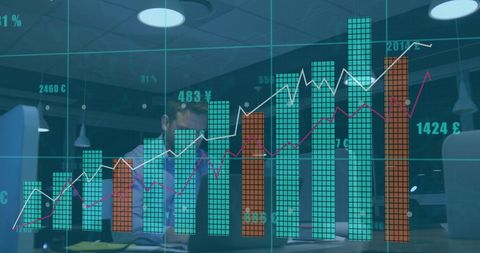
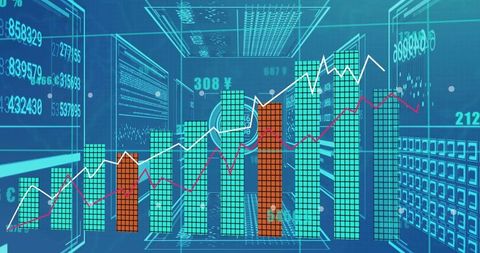
- Futuristic Financial Data Visualization Chart and Global Analytics
Futuristic Financial Data Visualization Chart and Global Analytics Image

Digital visualization of financial data with graph bars and lines suggests modern analysis techniques, useful for business presentations, future technology articles, economic forecasts, and artificial intelligence projects.
Powered by 


downloads
Tags:
More
Credit Photo
If you would like to credit the Photo, here are some ways you can do so
Text Link
photo Link
<span class="text-link">
<span>
<a target="_blank" href=https://pikwizard.com/photo/futuristic-financial-data-visualization-chart-and-global-analytics/ed3ae5f31f7c97907c8e8cbb426a4833/>PikWizard</a>
</span>
</span>
<span class="image-link">
<span
style="margin: 0 0 20px 0; display: inline-block; vertical-align: middle; width: 100%;"
>
<a
target="_blank"
href="https://pikwizard.com/photo/futuristic-financial-data-visualization-chart-and-global-analytics/ed3ae5f31f7c97907c8e8cbb426a4833/"
style="text-decoration: none; font-size: 10px; margin: 0;"
>
<img src="https://pikwizard.com/pw/medium/ed3ae5f31f7c97907c8e8cbb426a4833.jpg" style="margin: 0; width: 100%;" alt="" />
<p style="font-size: 12px; margin: 0;">PikWizard</p>
</a>
</span>
</span>
Free (free of charge)
Free for personal and commercial use.
Author: Awesome Content
Similar Free Stock Images

Premium


Premium


Premium

Premium


Premium
Premium


Premium


Premium

Premium

Premium


Premium

Premium


Premium


Premium


Premium


Premium


Premium


Premium


Premium


Premium


Premium

Premium


Premium

Premium

Premium


Explore More Free Stock Images