
- Home >
- Stock Photos >
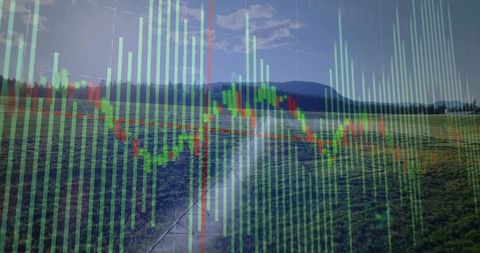
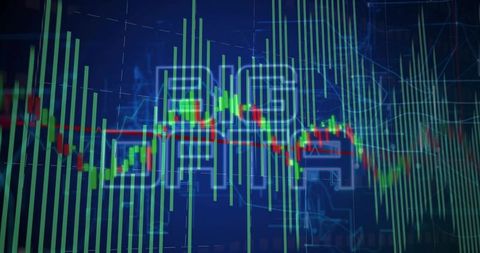
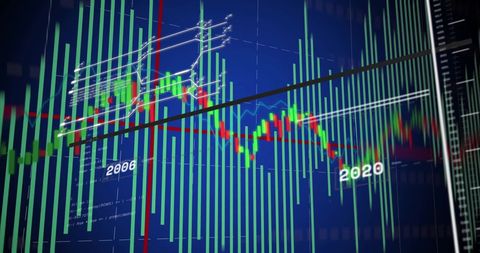
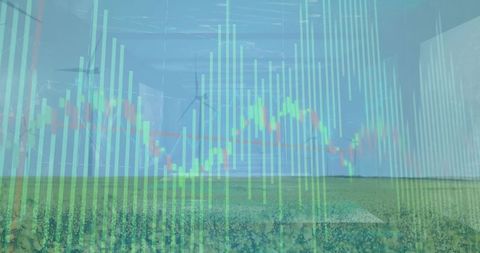
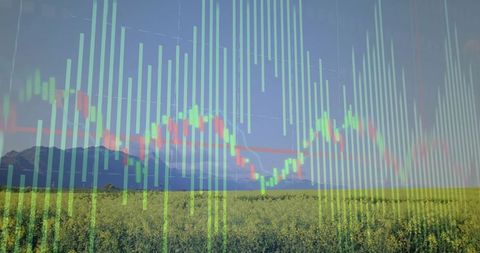
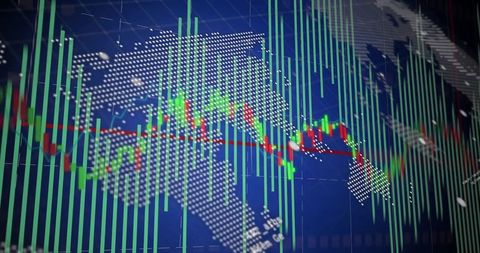
- Futuristic Financial Data Visualization with Dynamic Bars
Futuristic Financial Data Visualization with Dynamic Bars Image
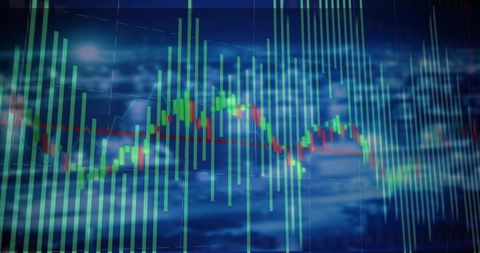
An abstract depiction of data analysis using green vertical bars and a red and green line pattern against a blue background simulating real-time financial metrics. Ideal for illustrating modern financial technology, stock market prediction, data analytics, dashboard interfaces, digital innovation, and investment strategies in various digital and print media.
Powered by  - Get 15% off with code: PIKWIZARD15


downloads
Tags:
More
Credit Photo
If you would like to credit the Photo, here are some ways you can do so
Text Link
photo Link
<span class="text-link">
<span>
<a target="_blank" href=https://pikwizard.com/photo/futuristic-financial-data-visualization-with-dynamic-bars/970feea7a5b9b481c631545d025640ef/>PikWizard</a>
</span>
</span>
<span class="image-link">
<span
style="margin: 0 0 20px 0; display: inline-block; vertical-align: middle; width: 100%;"
>
<a
target="_blank"
href="https://pikwizard.com/photo/futuristic-financial-data-visualization-with-dynamic-bars/970feea7a5b9b481c631545d025640ef/"
style="text-decoration: none; font-size: 10px; margin: 0;"
>
<img src="https://pikwizard.com/pw/medium/970feea7a5b9b481c631545d025640ef.jpg" style="margin: 0; width: 100%;" alt="" />
<p style="font-size: 12px; margin: 0;">PikWizard</p>
</a>
</span>
</span>
Free (free of charge)
Free for personal and commercial use.
Author: People Creations
Similar Free Stock Images
Premium


Premium

Premium


Premium


Premium


Premium


Premium


Premium


Premium

Premium


Premium


Premium


Premium


Premium

Premium


Premium


Premium


Premium


Premium


Premium


Premium

Premium


Premium


Premium


Premium


Explore More Free Stock Images