1. Home > 
  2. Stock Photos > 
  3. Futuristic Financial Data Visualization with Dynamic Graphs

Futuristic Financial Data Visualization with Dynamic Graphs Image

Futuristic Financial Data Visualization with Dynamic Graphs

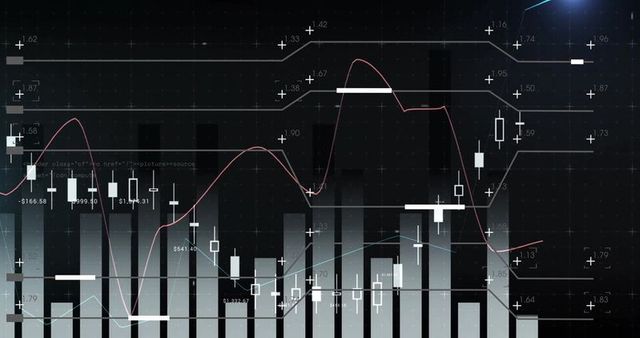
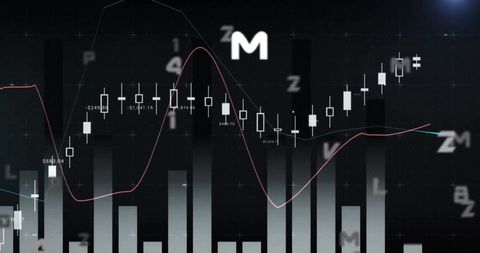
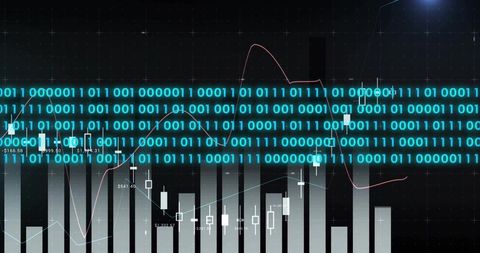
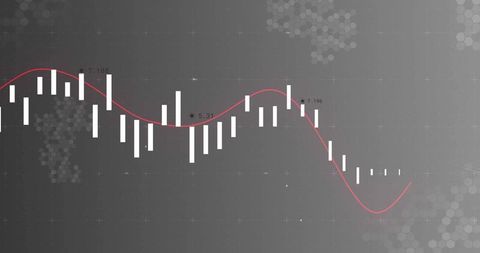
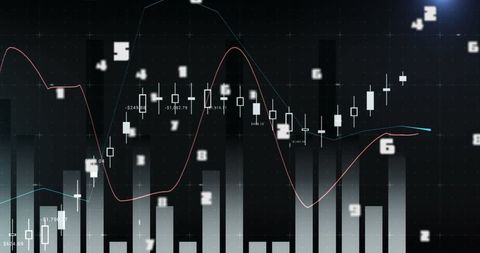
This image of fluctuating financial graphs on a dark background represents complex data analyses in stocks and trading. Ideal for use in financial market presentations, economic analysis reports, investment websites, and technology-focused blogs, showcasing advanced data insight capabilities.

Powered by Adobe logo
Financial market data analysis with glowing 3D bar and line charts on dark background showing economic trends and growth concept visualization. 3D Rendering - Powered by AdobeDynamic stock market graph with vibrant blue and purple hues, showcasing upward trends and financial data visualization in a modern digital interface. - Powered by AdobeData analyzing and stock market visualization with digital charts, financial dashboards, and performance metrics. Ideal for investment analysis, trading strategy, and economic forecasting. - Powered by AdobeAbstract financial stock market graph with candlestick bars isolated on transparent background - Powered by AdobeAbstract data visualization of financial market trends.  Dynamic display of stock market analysis - Powered by Adobe

Credit Photo

If you would like to credit the Photo, here are some ways you can do so

Free (free of charge)

Free for personal and commercial use.

Author: Awesome Content

Similar Free Stock Images

Abstract Financial Chart Technology Interface
Premium
Abstract financial chart with line graph and bokeh lights representing stock market data and investment analysis for business presentations
Abstract Financial Data Visualization with Floating Numbers
Data Analysis With Cityscape and Digital Charts
Analyzing Financial Downtrend with Digital Data Concepts
Abstract Digital Financial Market Analysis Concept
Premium
Global financial market data visualization
Abstract Financial Charts in Futuristic Design
Abstract Financial Graph and Data Analysis Background
Dynamic Financial Data Analysis with Illuminated Graphs
Global Data Processing in Virtual Environment
Premium
Abstract financial data visualization with bars and lines
Financial Data Overlaid on DNA with COVID-19 Imagery
Financial Chart and Data Analysis Background Technology Concept
Digital Financial Graph and City Silhouette Backdrop
Financial Data Analytics Over Urban Skyline Backdrop
Premium
Stock market financial chart features blue candlesticks on a dar
Financial Data Processing on Grey Digital Background
Dynamic Financial Data Analysis in Digital Interface
Digital Data Chart on Grey Background with Red Trend Line
Modern Digital Financial Chart Interface with Fluctuating Graphs
Premium
Dynamic stock market chart with vibrant blue and pink bars showing upward trend and financial data visualization in a futuristic digital interface
Complex Data Analytics Overlay in High-Tech Server Room
Innovative Digital Finance Data Display on Dark Interface
Digital Chart Overlays in Empty Office Space
Dynamic Financial Data Visualization with Binary Code Overlay
Premium
Dynamic digital financial graph with glowing purple and blue trend lines on dark background displaying market analytics data for investment technology
Digital Stock Market Analysis with Graphs and Charts on Black Background
Dynamic Financial Data Chart on Dark Digital Dashboard
Futuristic Data Visualization with Highlighted Analytics Trends
Digital Grid Displaying Financial Line Graphs and Candlesticks
Dynamic Financial Data Visualization with Blue Trends
Digital Visualization of Financial and Statistical Data
Premium
Abstract digital data visualization of financial stock market growth and analysis with glowing lines and binary code background
Digital Financial Data Visualization with Urban Cityscape
Declining Financial Forecast with Digital Interface
Abstract Financial Market Data Analysis Visualization
Data Processing Visualization with Cityscape Background
Premium
Digital golden bar graph showing stock market finance data
Abstract Financial Data Graph with Stock Market Trends
Stagflation Concept with Digital Graphs and Data Patterns
Financial Data and Graphs on Digital Blue Background
Digital Graphs Representing Data and Analytics on Black Background
Premium
Abstract financial graph with neon lines showing market trends and data analysis display
High-Tech Financial Data Analysis Display with Graphs
Abstract Financial Data Chart Over Urban Skyline
Visualizing Financial Data Trends Over Urban Backdrop
Graph Showing Stock Market Activity and Financial Data Analysis
Premium
stock market visual metaphor concept. A crystal ball displaying financial graph trends on a dark cushion.
Digital Financial Graphs on Dark Background Highlighting Global Economy Trends
Digital Stock Market Data Analysis with Graphs
Financial Graphs and Charts on Digital Interface
Abstract Data Visualization on Blue Background for Technology Concept
Premium
Transparent stock market investment trading graph growth faceless financial visualization slightly defocused business analytics background trade data analysis economic chart
Digital Financial Graphs and Data Analysis Visualization
Dynamic Data Graphs Display on Dark Digital Background
Abstract Technology Background with Financial Graphs and Charts
Financial Data Visualization with Declining Trend Line
Premium
Financial market data visualization a dynamic chart displaying stock price trends and fluctuations over time
Digital Financial Trading Dashboard with Candlestick and Bar Graphs
Futuristic Financial Analytics with Binary Code Streaming
Digital Financial Chart with Trend Line and Bar Overlay
Digital Financial Data Analysis with Chart and Markers
Financial Data Analysis with Bar and Line Graphs
Financial Data Analytics Digital Display With Dynamic Charts
Premium
Rising financial graph with glowing data lines showing market growth trends
Financial Data Analysis with Abstract Graphs
Advanced Data Processing with Trend Charts on Black Background
Abstract Financial Data with Neon Line Graph and Candlestick Chart
Abstract Financial Charts with Graphs and Data Visualization
Premium
Abstract financial chart with lush green background
Financial Data Charts and Graphs on Digital Interface
Financial Data Visualization with Line and Bar Graphs
Abstract Digital Graphs on Black Background
Global Finance and COVID-19 Impact Representation
Premium
Digital glowing stock market chart with options trend and index data on a dark background, symbolizing economic growth, trading, and financial technology.
Financial Data Over Cityscape with Glowing Graph Lines
Global Business Dashboard Overlay on Urban Skyline Background
Digital Stock Market Chart and Networking Interface
Abstract Financial Data Chart Background with Graphs
Premium
Financial graph showing market data and investment trends on glass, blurring business people walking modern corporate corridor
Financial Analytics with Chart and Graph Overlay on Digital Background
Abstract Financial Data Charts on Black Background
Dynamic Financial Data Visualization with Moving Numbers
Financial Data Overlaid on Server Room Showing Business Growth
Premium
Magnifying glass examining a glowing blue stock market financial graph with upward trending data on a dark background
Dynamic Stock Market Trends and Financial Data Graph
Innovative Data Analysis over DNA Strand
Financial Data Analysis with Graphs on Grey Background
Dynamic Financial Data Interface with Changing Statistics
Premium
Financial market analysis with stock graph overlay and industrial skyline at dusk
Digital Financial Dashboard with Candlestick Charts and Trend Analysis
Dark Trading Dashboard Showing Candlestick Chart, Volume Histogram, Moving Averages and Indicators
Digital Graphs Displaying Financial Data Analysis in Blue
Digital Financial Graphs and Charts on Dark Background
Analyzing Financial Data with Graphs and Charts
Financial Data Analysis and Decline Interpretation
Premium
Abstract digital financial stock market chart with candlestick bars and line graph data visualization
Digital Financial Chart Over Cityscape Backdrop
Futuristic Data Analytics with Graphs and Charts
Abstract Digital Chart in Futuristic Financial Analysis Concept
Candlestick Chart with Moving Averages on Dark Background
Premium
Abstract financial graph with green and blue gradient representing stock market growth
Abstract Financial Market Analysis with Candlestick and Bar Charts
Abstract Financial Data Analysis with City Skyline
Financial Data and Blood Vessels Fusion Exploring Adaptive Business Intelligence
Analyzing Financial Graphs with Real-Time Data Trends
Premium
Abstract blue chart with lines and dots on dark background depicting financial data analysis, concept for stock market forecasting, business intelligence and technological innovation
Digital Financial Data Over Cityscape Representation
Financial Data Analysis with Graphs in Futuristic Overlay
Digital Stock Market Analysis with Graphs and Charts
Abstract Financial Data Visualization with Graphs
Premium
The magnifying glass highlighting financial data and market trends on paper.
Bar Graph with Downward Trend and Heartbeat Line
Abstract Financial Data with Graphs and Charts Visualization
Modern Finance Analytics with Digital Charts and Data
Financial Data Analysis with Graphs and Charts on Dark Background
Premium
Analyzing stock market trends on a digital tablet
Dynamic Financial Data with Fluctuating Graph Lines
Abstract Data Visualization with Graphs over Digital Grid Background
Financial Trading Chart Overlaying World Map with Red Trend Line
Futuristic Data Visualization with Bars and Trend Line
Premium
Futuristic digital data visualization showing abstract technology graph waves of financial market analytics and network connection success
Neon Candlestick Chart Featuring Moving Averages, Segmented Trendline and Delta Labels on Trading UI