
- Home >
- Stock Photos >
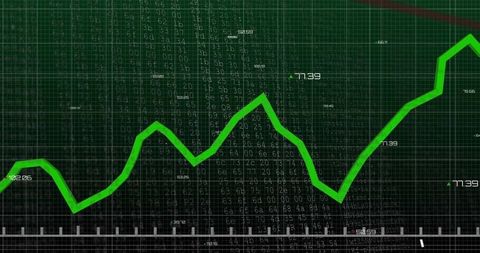
- Futuristic Green Data Graph with Digital Interference Design
Futuristic Green Data Graph with Digital Interference Design Image

Dynamic graph against intricate digital interface highlights data processing and futuristic trending in tech or finance fields. Useful for visuals in reports, presentations on business forecasts, technology research, stock market analysis, or IT solutions marketing.
Powered by  - Get 15% off with code: PIKWIZARD15


downloads
Tags:
More
Credit Photo
If you would like to credit the Photo, here are some ways you can do so
Text Link
photo Link
<span class="text-link">
<span>
<a target="_blank" href=https://pikwizard.com/photo/futuristic-green-data-graph-with-digital-interference-design/90d38b2e787dc58fa66e164e6160f91a/>PikWizard</a>
</span>
</span>
<span class="image-link">
<span
style="margin: 0 0 20px 0; display: inline-block; vertical-align: middle; width: 100%;"
>
<a
target="_blank"
href="https://pikwizard.com/photo/futuristic-green-data-graph-with-digital-interference-design/90d38b2e787dc58fa66e164e6160f91a/"
style="text-decoration: none; font-size: 10px; margin: 0;"
>
<img src="https://pikwizard.com/pw/medium/90d38b2e787dc58fa66e164e6160f91a.jpg" style="margin: 0; width: 100%;" alt="" />
<p style="font-size: 12px; margin: 0;">PikWizard</p>
</a>
</span>
</span>
Free (free of charge)
Free for personal and commercial use.
Author: People Creations
Similar Free Stock Images

Premium


Premium

Premium


Premium


Premium


Premium


Premium

Premium

Premium

Premium


Premium


Premium


Premium


Premium


Premium


Premium


Premium


Premium


Premium


Premium

Premium


Premium


Premium


Premium


Premium


Explore More Free Stock Images