
- Home >
- Stock Photos >
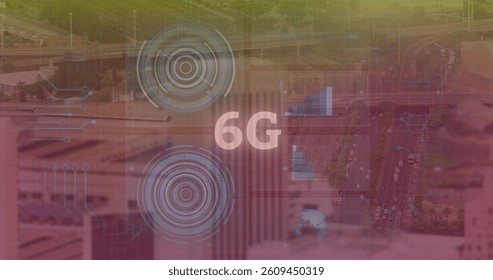
- Futuristic Technology Concept with Global Data Visualization
Futuristic Technology Concept with Global Data Visualization Image

Depicting advanced communication technology with a digital display of global data and integrated circuit patterns, this portrayal emphasizes future trends in network connectivity. Ideal for illustrating concepts related to next-generation networking, technological advancements, and innovations in digital communication. Useful for presentations on tech development or marketing materials in tech industries.
Powered by  - Get 15% off with code: PIKWIZARD15


downloads
Tags:
More
Credit Photo
If you would like to credit the Photo, here are some ways you can do so
Text Link
photo Link
<span class="text-link">
<span>
<a target="_blank" href=https://pikwizard.com/photo/futuristic-technology-concept-with-global-data-visualization/5210246230da9906681a04d092dcc111/>PikWizard</a>
</span>
</span>
<span class="image-link">
<span
style="margin: 0 0 20px 0; display: inline-block; vertical-align: middle; width: 100%;"
>
<a
target="_blank"
href="https://pikwizard.com/photo/futuristic-technology-concept-with-global-data-visualization/5210246230da9906681a04d092dcc111/"
style="text-decoration: none; font-size: 10px; margin: 0;"
>
<img src="https://pikwizard.com/pw/medium/5210246230da9906681a04d092dcc111.jpg" style="margin: 0; width: 100%;" alt="" />
<p style="font-size: 12px; margin: 0;">PikWizard</p>
</a>
</span>
</span>
Free (free of charge)
Free for personal and commercial use.
Author: Awesome Content
Similar Free Stock Images

Premium


Premium

Premium


Premium


Premium


Premium


Premium


Premium

Premium

Premium


Premium

Premium


Premium


Premium

Premium


Premium

Premium


Premium


Premium


Premium


Premium


Premium

Premium


Premium


Premium


Explore More Free Stock Images