- Home >
- Stock Photos >
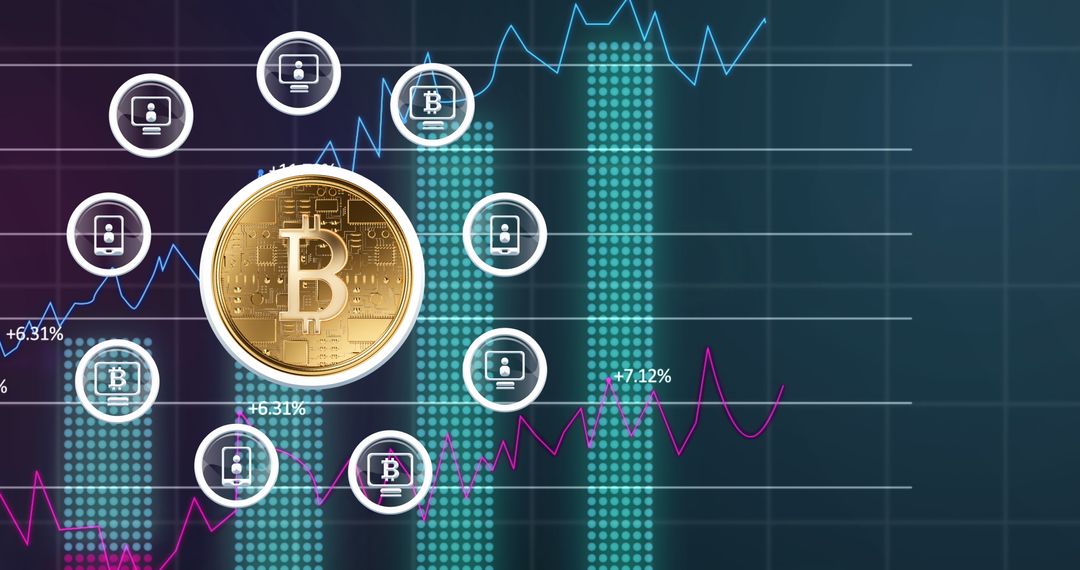
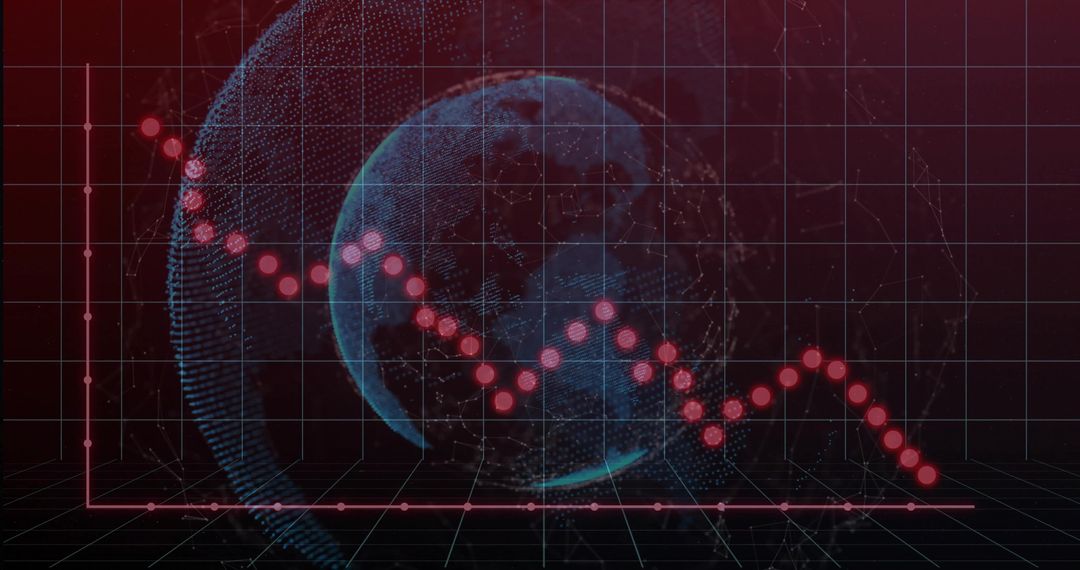
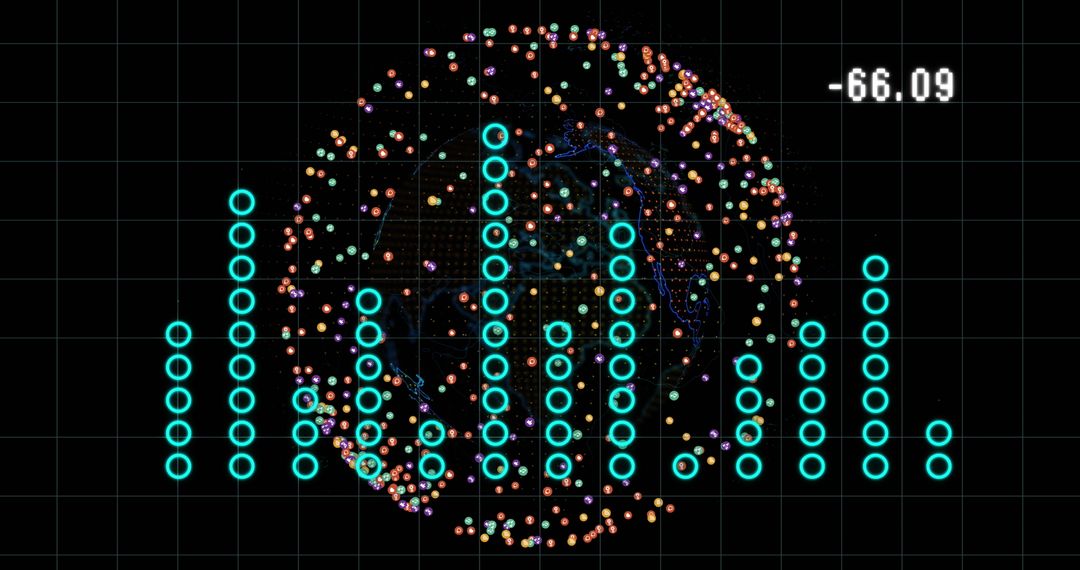
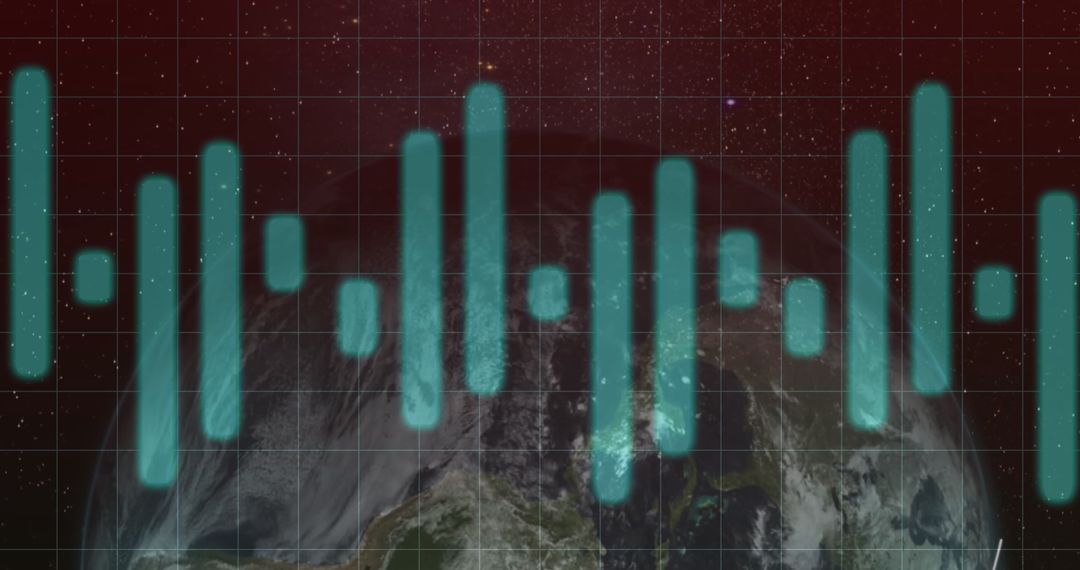
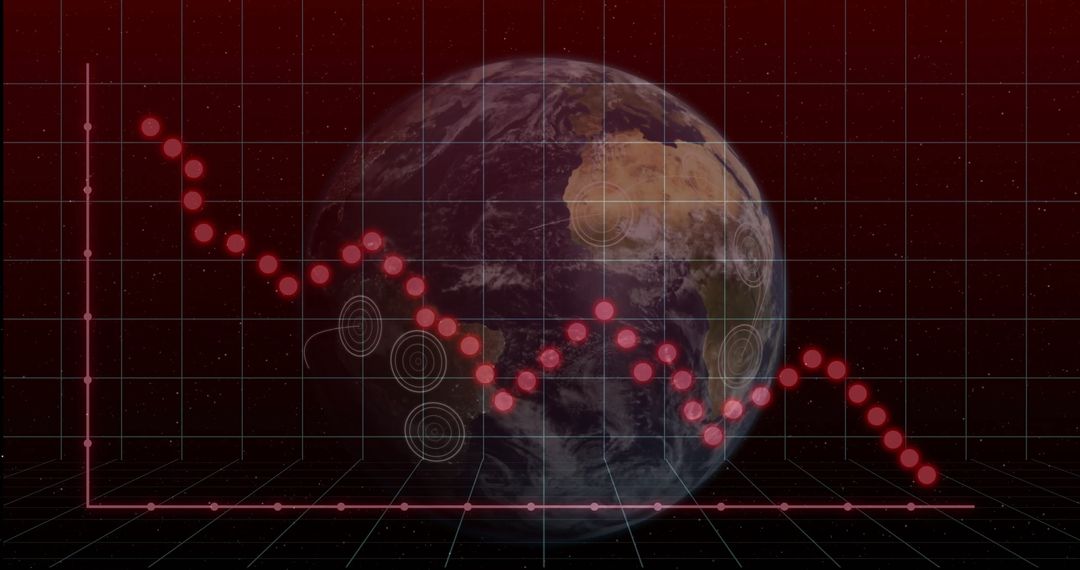
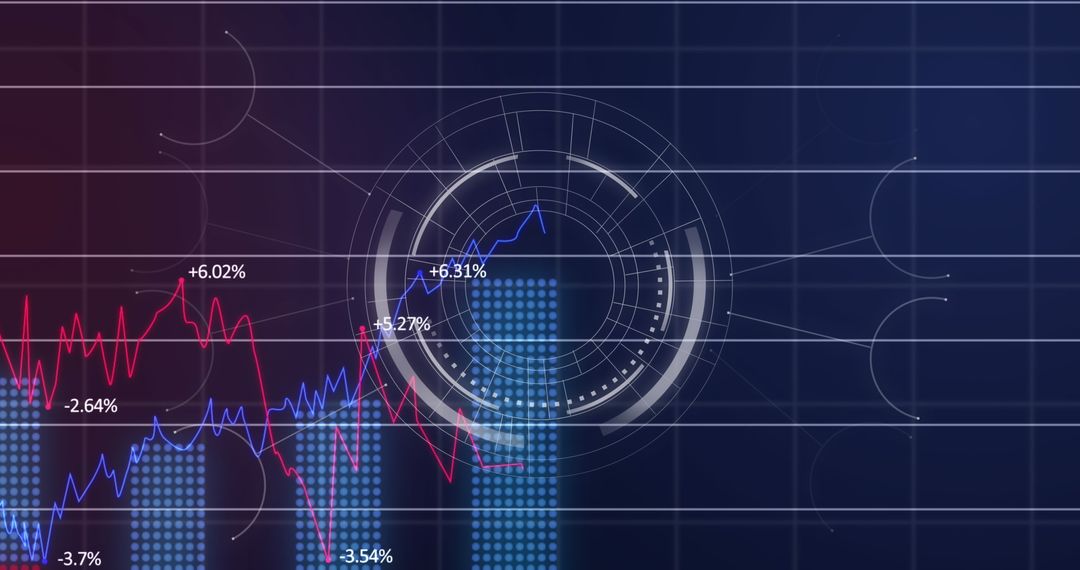
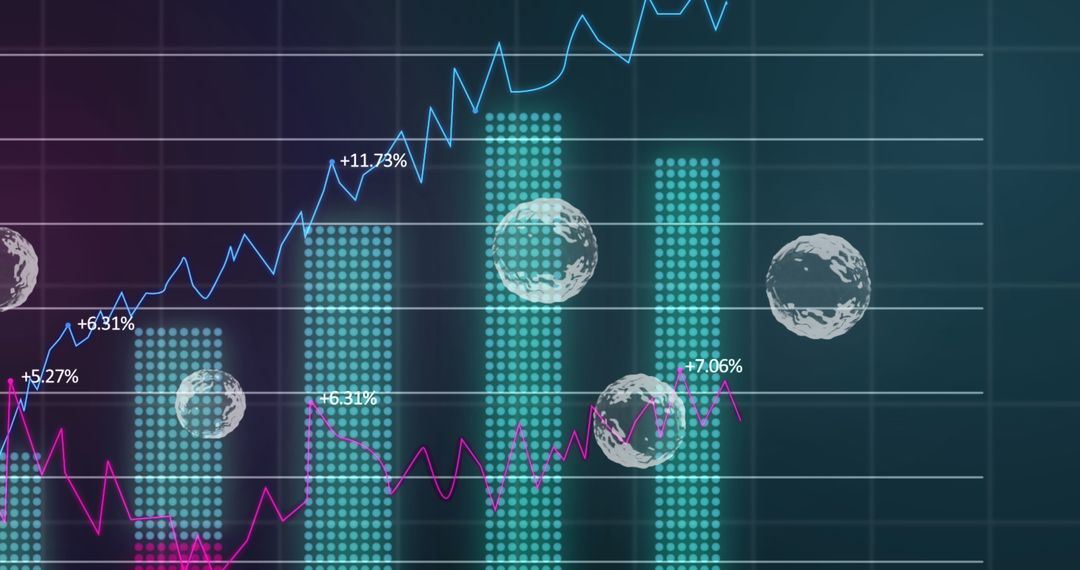
- Global Analytics Dashboard Featuring Translucent Earth Globe with Neon Cyan Histogram Grid
Global Analytics Dashboard Featuring Translucent Earth Globe with Neon Cyan Histogram Grid Image

Showing translucent Earth globe layered over dark green grid with neon cyan circular histogram bars and faint numerical readout. Creating futuristic dashboard aesthetic ideal for global analytics, big data reporting, finance dashboards, cybersecurity displays, and IoT visualizations. Working well as website header, presentation slide background, annual report graphic, pitch deck visual, or marketing banner. Supporting use in broadcast graphics and animated video overlays for tech demos and product launches. Offering high-contrast composition for headline overlays, data storytelling, editorial illustration, and UI mockups.
Powered by 


0
downloads
downloads
Tags:
More
Credit Photo
If you would like to credit the Photo, here are some ways you can do so
Text Link
photo Link
<span class="text-link">
<span>
<a target="_blank" href=https://pikwizard.com/photo/global-analytics-dashboard-featuring-translucent-earth-globe-with-neon-cyan-histogram-grid/5b76a7746bbaedfc429b600070423cd6/>PikWizard</a>
</span>
</span>
<span class="image-link">
<span
style="margin: 0 0 20px 0; display: inline-block; vertical-align: middle; width: 100%;"
>
<a
target="_blank"
href="https://pikwizard.com/photo/global-analytics-dashboard-featuring-translucent-earth-globe-with-neon-cyan-histogram-grid/5b76a7746bbaedfc429b600070423cd6/"
style="text-decoration: none; font-size: 10px; margin: 0;"
>
<img src="https://pikwizard.com/pw/medium/5b76a7746bbaedfc429b600070423cd6.jpg" style="margin: 0; width: 100%;" alt="" />
<p style="font-size: 12px; margin: 0;">PikWizard</p>
</a>
</span>
</span>
Free (free of charge)
Free for personal and commercial use.
Author: Authentic Images
Similar Free Stock Images
Premium


Premium


Premium


Premium


Premium


Premium


Premium


Premium


Premium


Premium


Premium


Premium


Premium


Premium


Premium


Premium


Premium


Premium


Premium


Premium


Premium


Premium


Premium


Premium