- Home >
- Stock Photos >
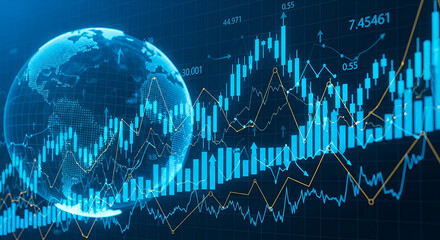
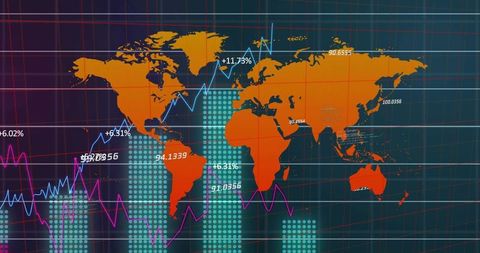
- Global Financial Analytics on Digital World Map
Global Financial Analytics on Digital World Map Image

Abstract representation of global financial data overlaid on a digital map of the world. Lines, bars, and percentages indicate trends in economic performance, suitable for illustrating topics related to finance, business growth, data science, or global economies. Ideal for use in presentations, websites, and articles focusing on economic forecasts and financial strategies.
Powered by 


downloads
Tags:
More
Credit Photo
If you would like to credit the Photo, here are some ways you can do so
Text Link
photo Link
<span class="text-link">
<span>
<a target="_blank" href=https://pikwizard.com/photo/global-financial-analytics-on-digital-world-map/dc399d0191801cb074f1f0756aac0e01/>PikWizard</a>
</span>
</span>
<span class="image-link">
<span
style="margin: 0 0 20px 0; display: inline-block; vertical-align: middle; width: 100%;"
>
<a
target="_blank"
href="https://pikwizard.com/photo/global-financial-analytics-on-digital-world-map/dc399d0191801cb074f1f0756aac0e01/"
style="text-decoration: none; font-size: 10px; margin: 0;"
>
<img src="https://pikwizard.com/pw/medium/dc399d0191801cb074f1f0756aac0e01.jpg" style="margin: 0; width: 100%;" alt="" />
<p style="font-size: 12px; margin: 0;">PikWizard</p>
</a>
</span>
</span>
Free (free of charge)
Free for personal and commercial use.
Author: People Creations
Similar Free Stock Images
Loading...

Premium

Premium


Premium

Premium

Premium


Premium


Premium


Premium


Premium


Premium


Premium


Premium


Premium


Premium


Premium


Premium


Premium


Premium

Premium


Premium


Premium


Premium

Premium

Premium


Premium