- Home >
- Stock Photos >
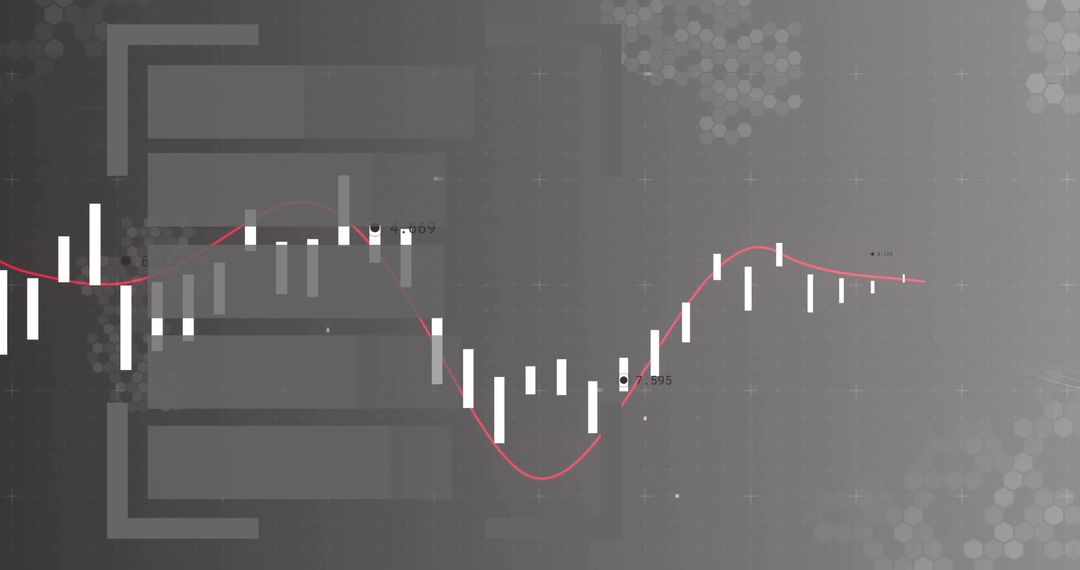
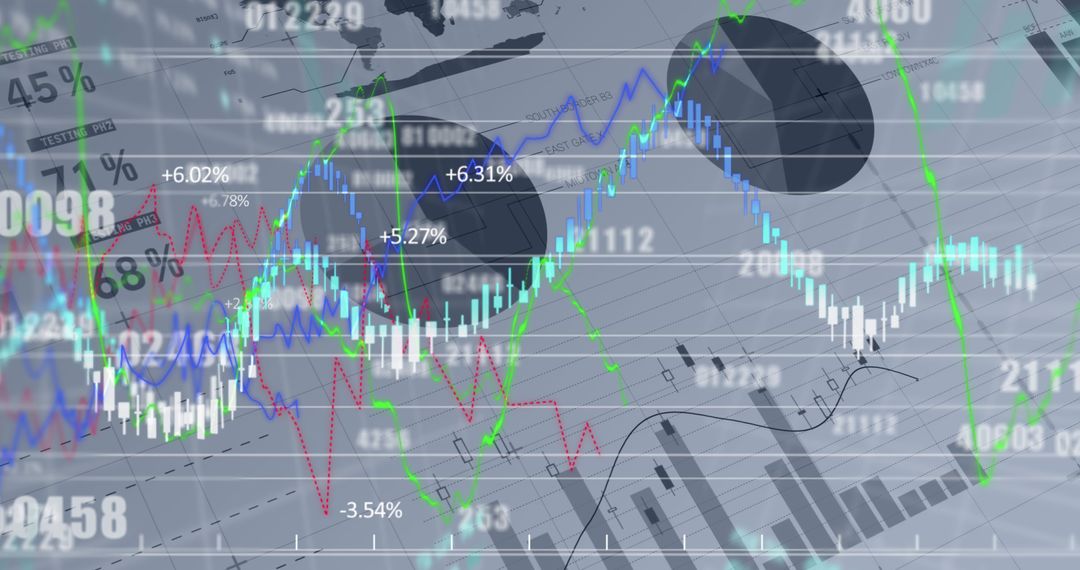
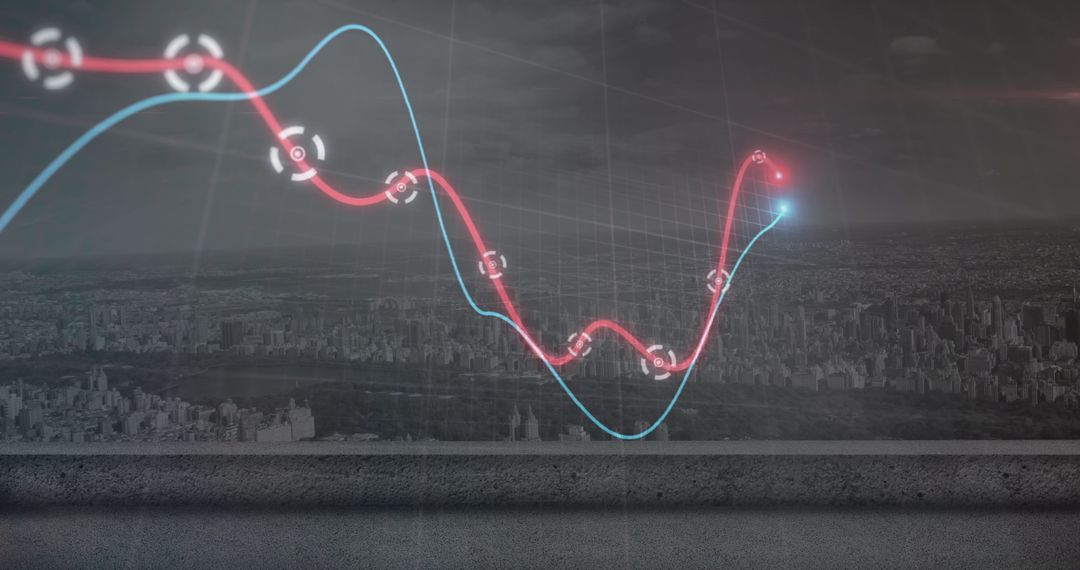
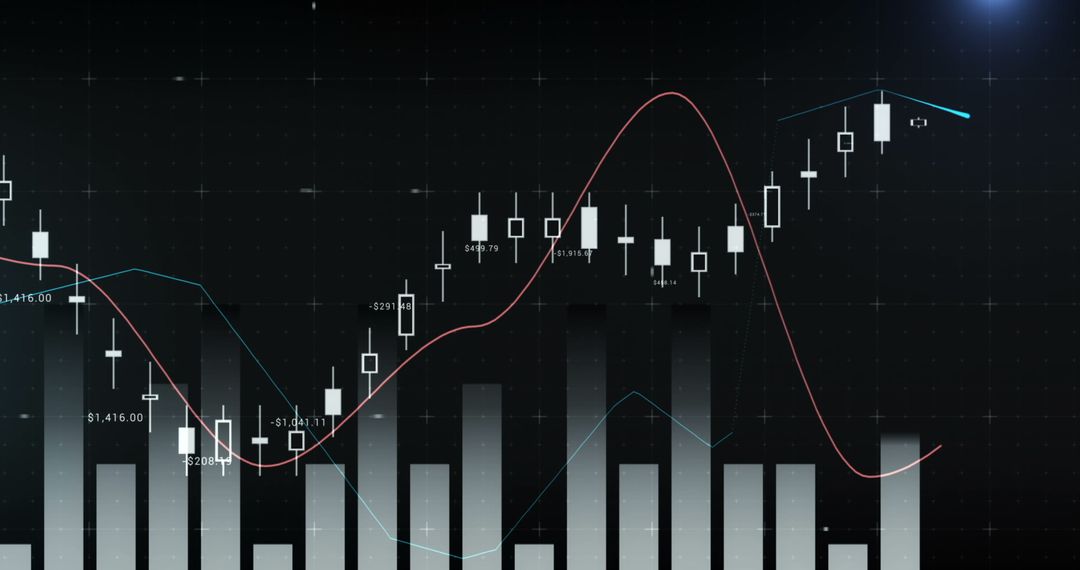
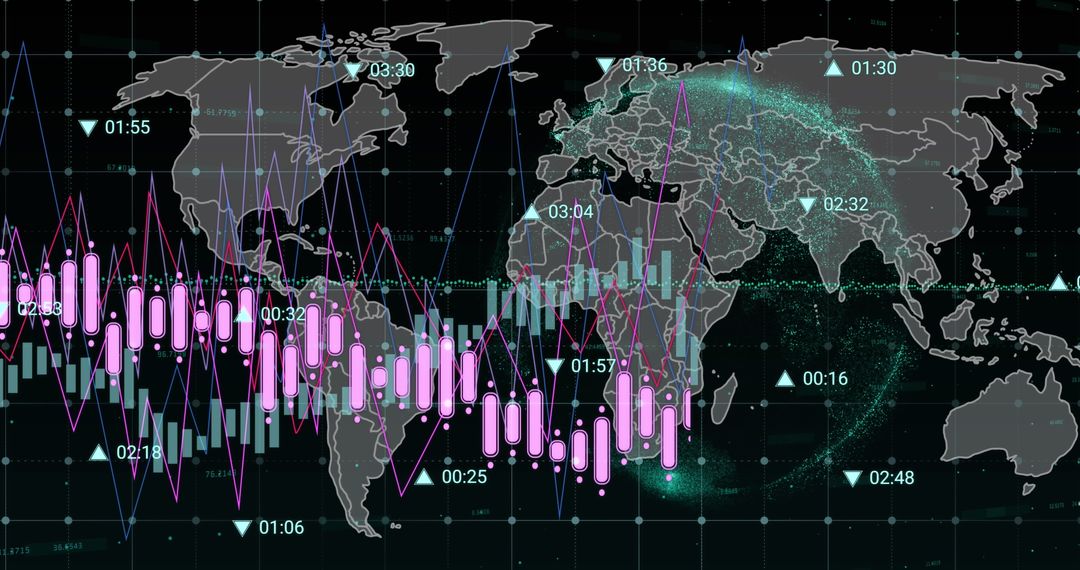
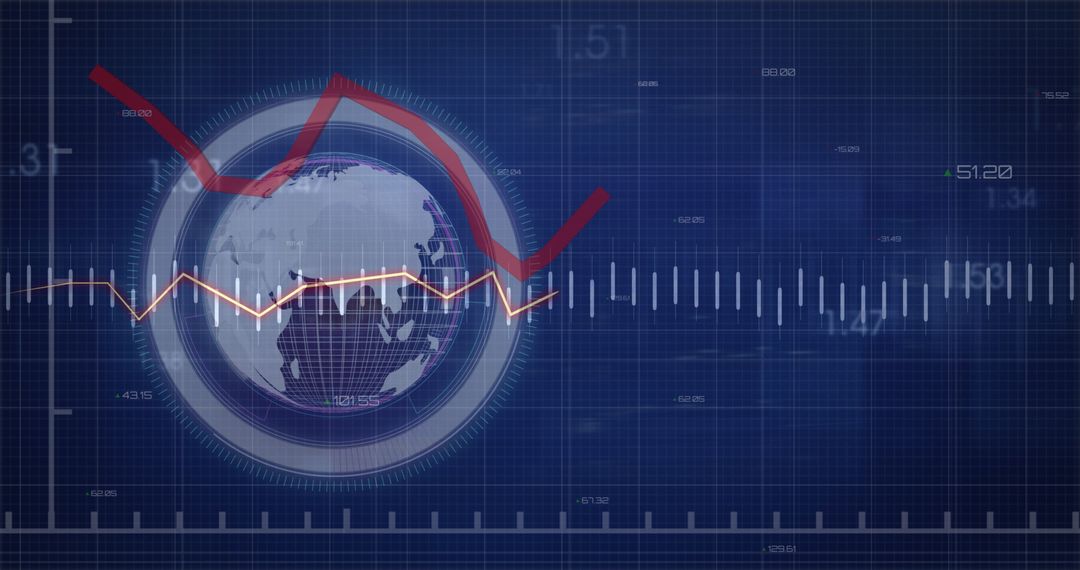
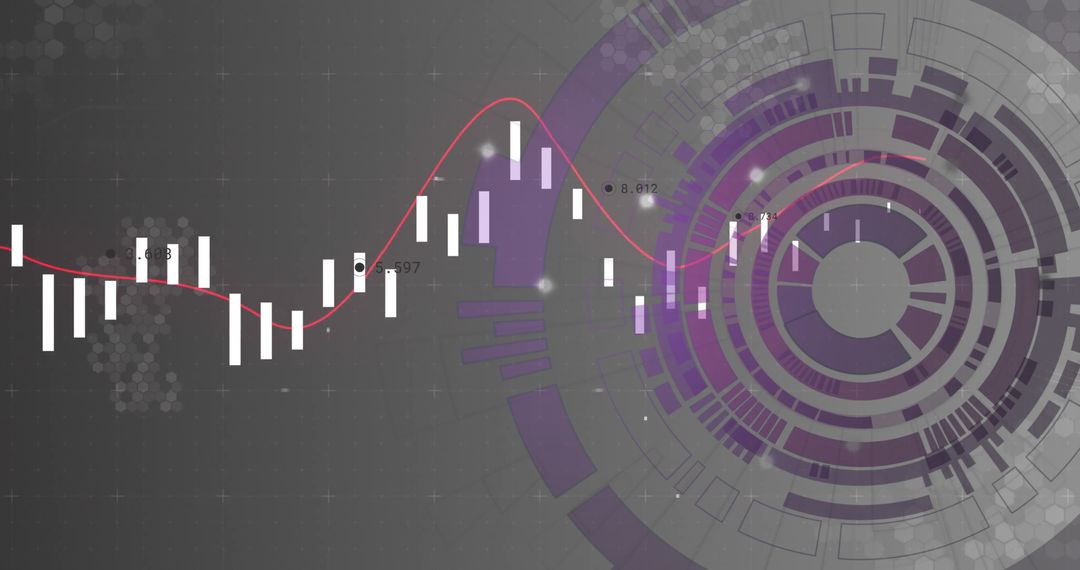
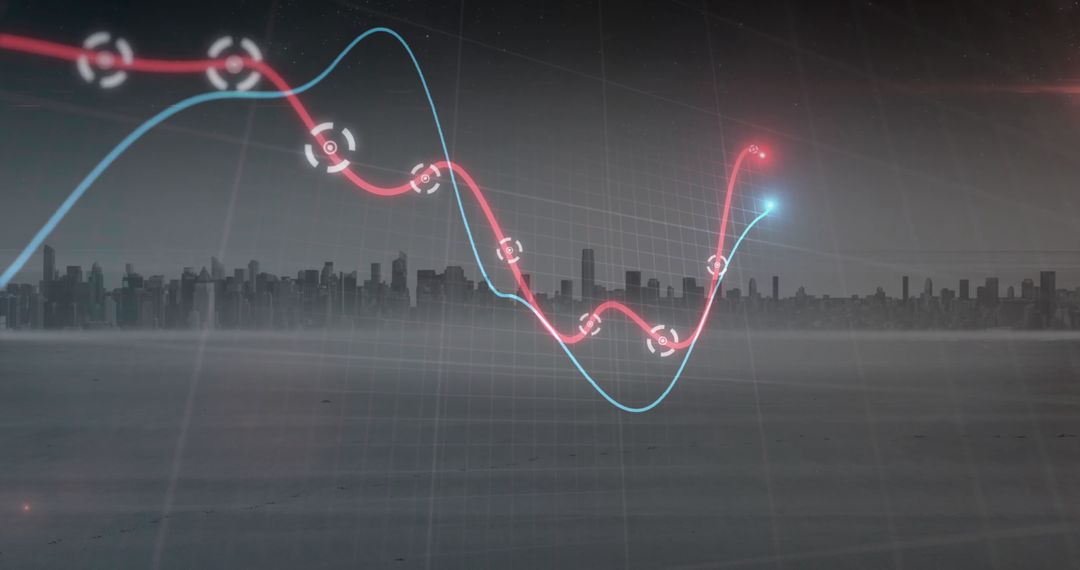
- Global financial dashboard displaying candlestick charts and red trend line on world map
Global financial dashboard displaying candlestick charts and red trend line on world map Image
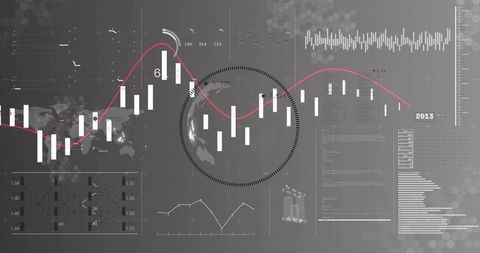
Showing central globe graphic with vertical candlestick bars and red trend line intersecting layered charts, histograms, and hexagon grid. Featuring muted gray palette with red accent for trend emphasis and subtle world map for global market context. Working well for business presentations, fintech websites, market analysis reports, financial blogs, investor pitch decks, trading platform UI mockups, and data journalism. Serving as hero background, header banner, slide visual, or editorial illustration. Suggesting recoloring trend line for brand alignment, adding logo overlay, or replacing numeric data for local markets. Delivering modern technology and analytics aesthetic for finance and investment communications.
Powered by 


0
downloads
downloads
Tags:
More
Credit Photo
If you would like to credit the Photo, here are some ways you can do so
Text Link
photo Link
<span class="text-link">
<span>
<a target="_blank" href=https://pikwizard.com/photo/global-financial-dashboard-displaying-candlestick-charts-and-red-trend-line-on-world-map/a9a5d862f8521a87183e9add2c3b2662/>PikWizard</a>
</span>
</span>
<span class="image-link">
<span
style="margin: 0 0 20px 0; display: inline-block; vertical-align: middle; width: 100%;"
>
<a
target="_blank"
href="https://pikwizard.com/photo/global-financial-dashboard-displaying-candlestick-charts-and-red-trend-line-on-world-map/a9a5d862f8521a87183e9add2c3b2662/"
style="text-decoration: none; font-size: 10px; margin: 0;"
>
<img src="https://pikwizard.com/pw/medium/a9a5d862f8521a87183e9add2c3b2662.jpg" style="margin: 0; width: 100%;" alt="" />
<p style="font-size: 12px; margin: 0;">PikWizard</p>
</a>
</span>
</span>
Free (free of charge)
Free for personal and commercial use.
Author: People Creations
Similar Free Stock Images

Premium


Premium


Premium


Premium


Premium


Premium


Premium


Premium


Premium


Premium


Premium


Premium


Premium


Premium


Premium


Premium


Premium


Premium


Premium


Premium


Premium


Premium


Premium


Premium