
- Home >
- Stock Photos >
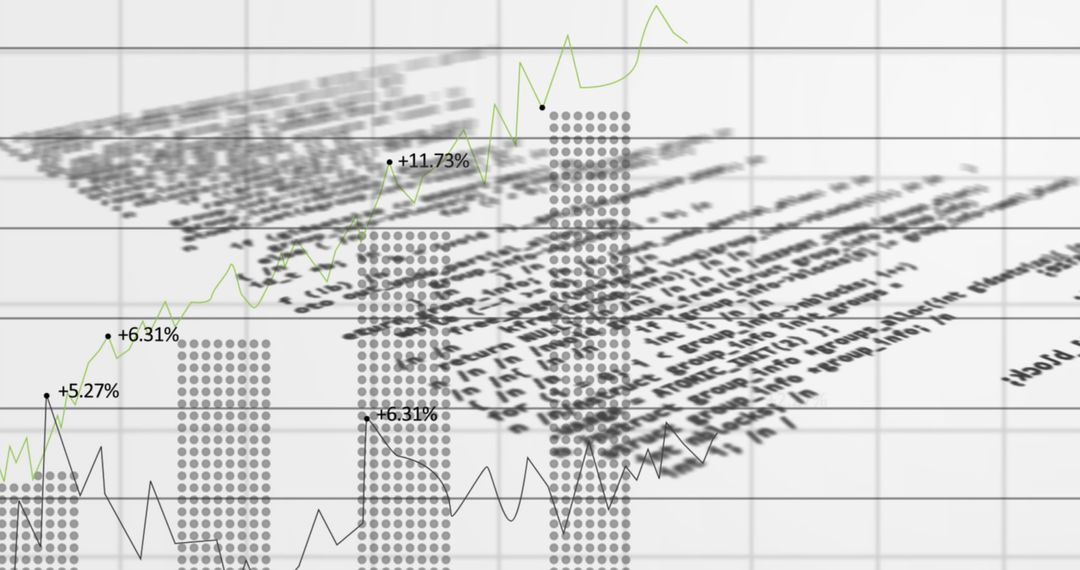
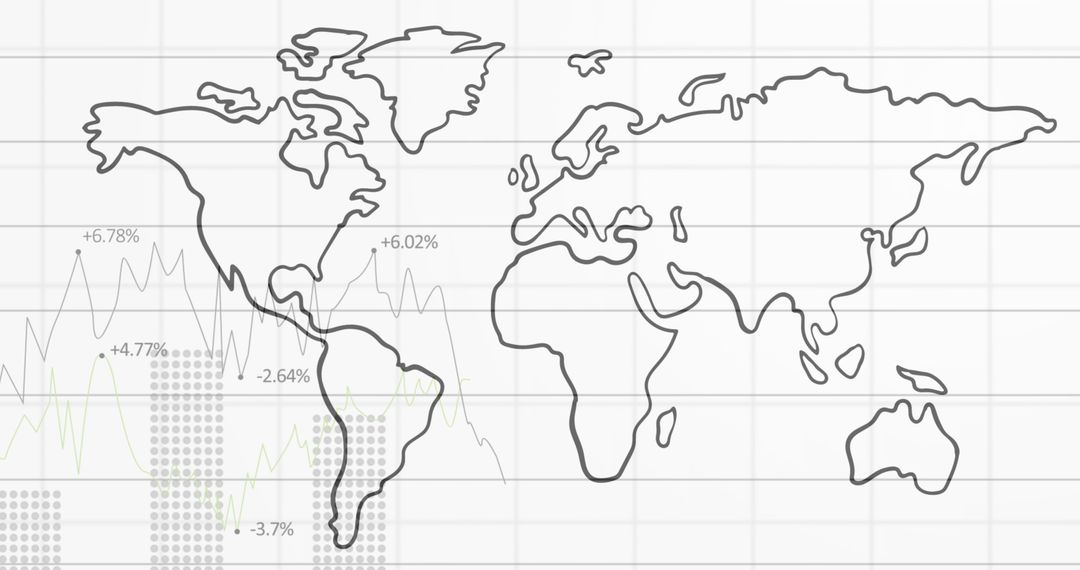
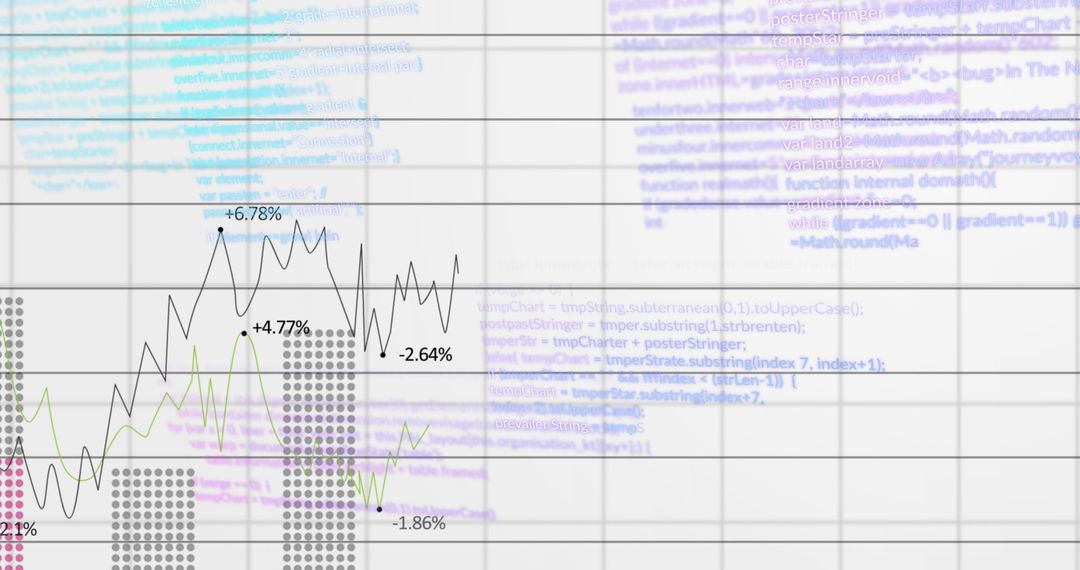
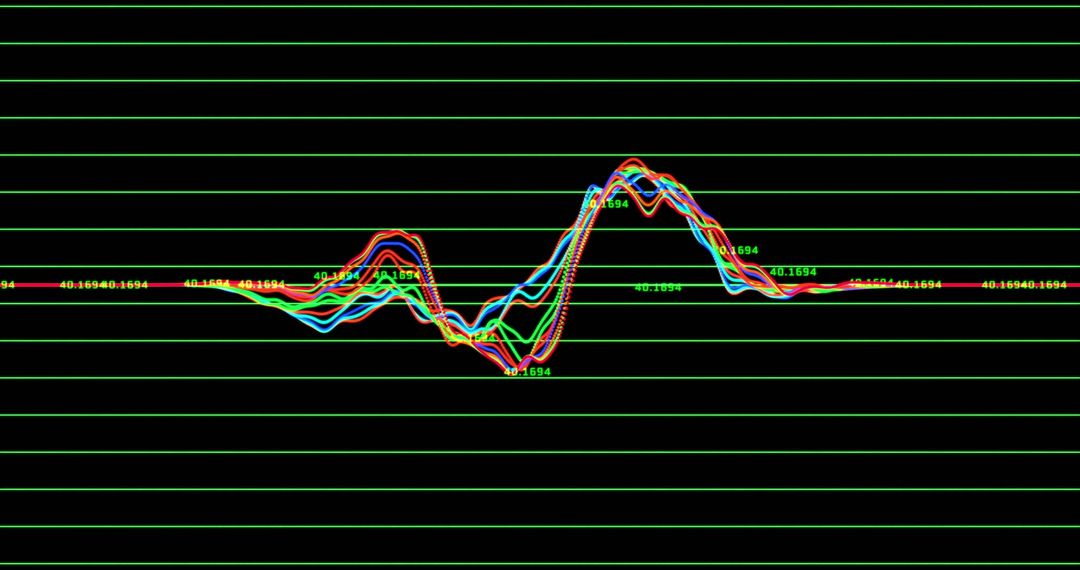
- Global Financial Growth and Data Analysis Representation
Global Financial Growth and Data Analysis Representation Image

The image showcases financial data processing with a focus on global growth analytics and statistics. Use this for business presentations related to global finance trends, market analysis, or economic forecasting reports. It offers a visual representation ideal for embedding in websites, educational materials, or reports discussing advanced computing methods.
Powered by  - Get 15% off with code: PIKWIZARD15


1
downloads
downloads
Tags:
More
Credit Photo
If you would like to credit the Photo, here are some ways you can do so
Text Link
photo Link
<span class="text-link">
<span>
<a target="_blank" href=https://pikwizard.com/photo/global-financial-growth-and-data-analysis-representation/97e7a6a4f2c652e3dd10d35adfaa635c/>PikWizard</a>
</span>
</span>
<span class="image-link">
<span
style="margin: 0 0 20px 0; display: inline-block; vertical-align: middle; width: 100%;"
>
<a
target="_blank"
href="https://pikwizard.com/photo/global-financial-growth-and-data-analysis-representation/97e7a6a4f2c652e3dd10d35adfaa635c/"
style="text-decoration: none; font-size: 10px; margin: 0;"
>
<img src="https://pikwizard.com/pw/medium/97e7a6a4f2c652e3dd10d35adfaa635c.jpg" style="margin: 0; width: 100%;" alt="" />
<p style="font-size: 12px; margin: 0;">PikWizard</p>
</a>
</span>
</span>
Free (free of charge)
Free for personal and commercial use.
Author: Authentic Images
Similar Free Stock Images

Premium


Premium


Premium


Premium


Premium


Premium


Premium


Premium


Premium


Premium


Premium


Premium


Premium


Premium


Premium


Premium


Premium


Premium


Premium


Premium


Premium


Premium


Premium


Premium

