
- Home >
- Stock Photos >
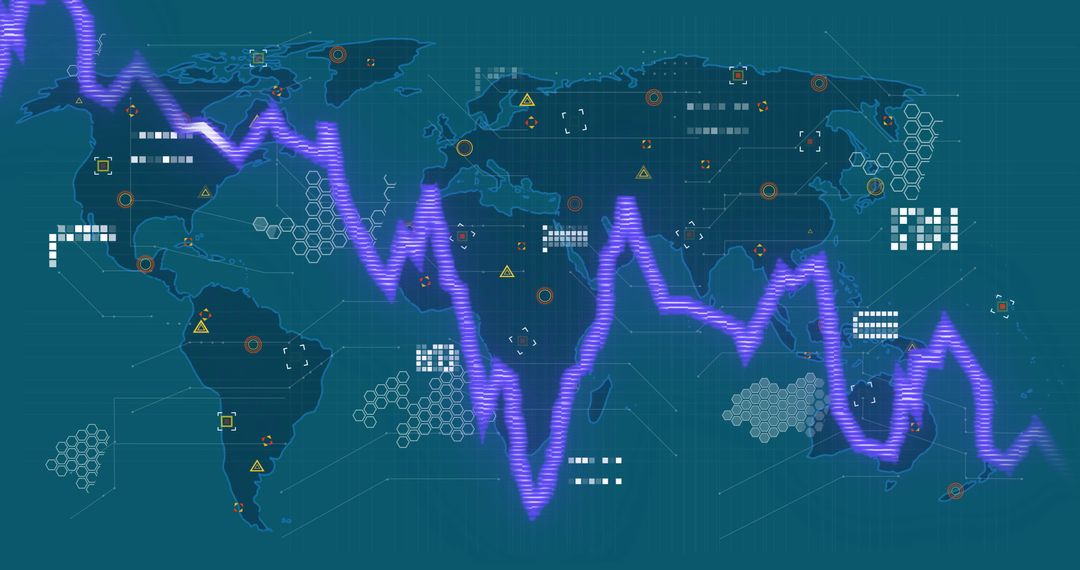
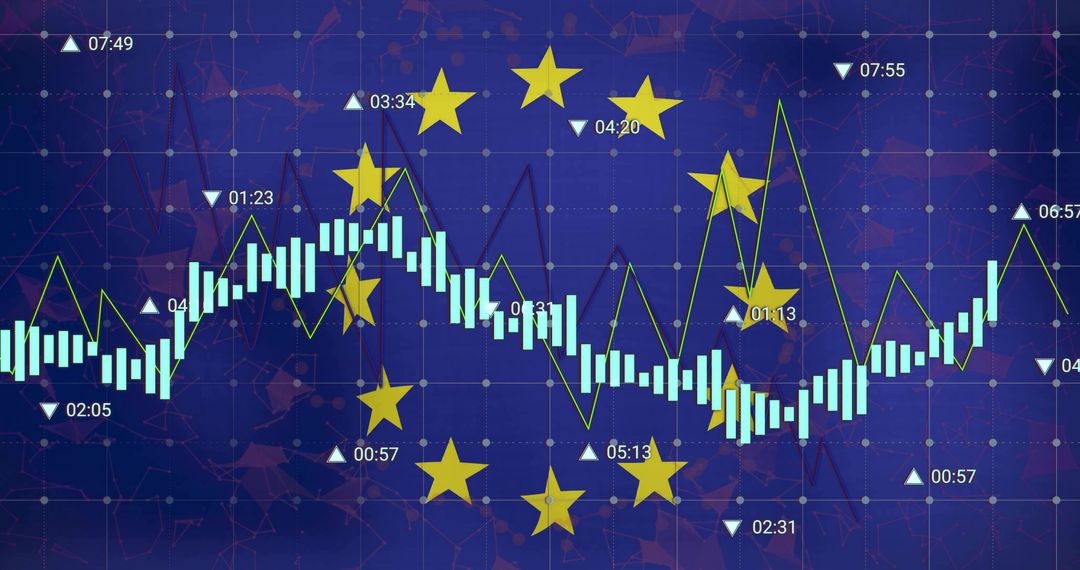
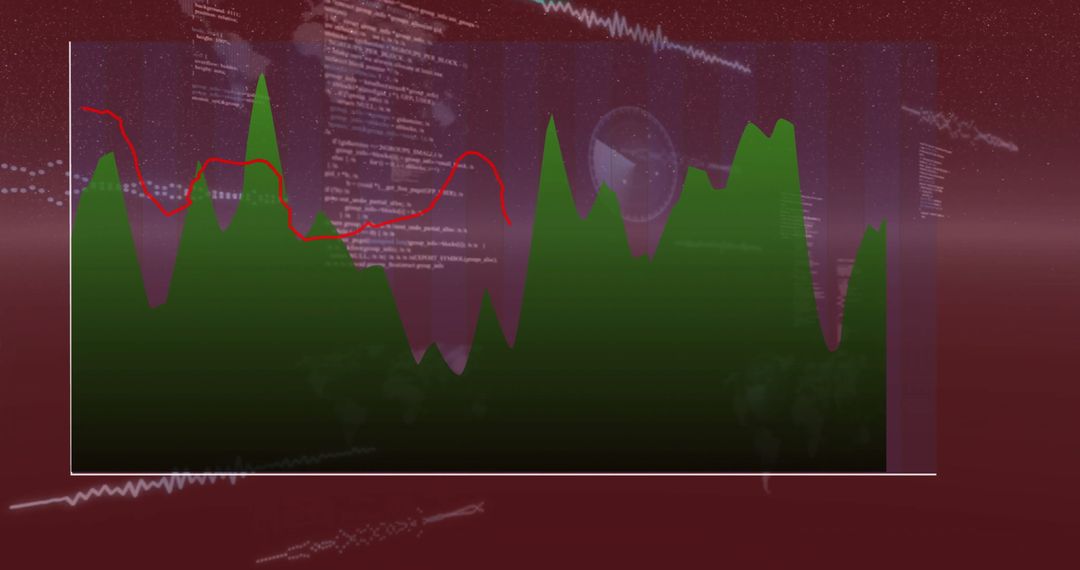
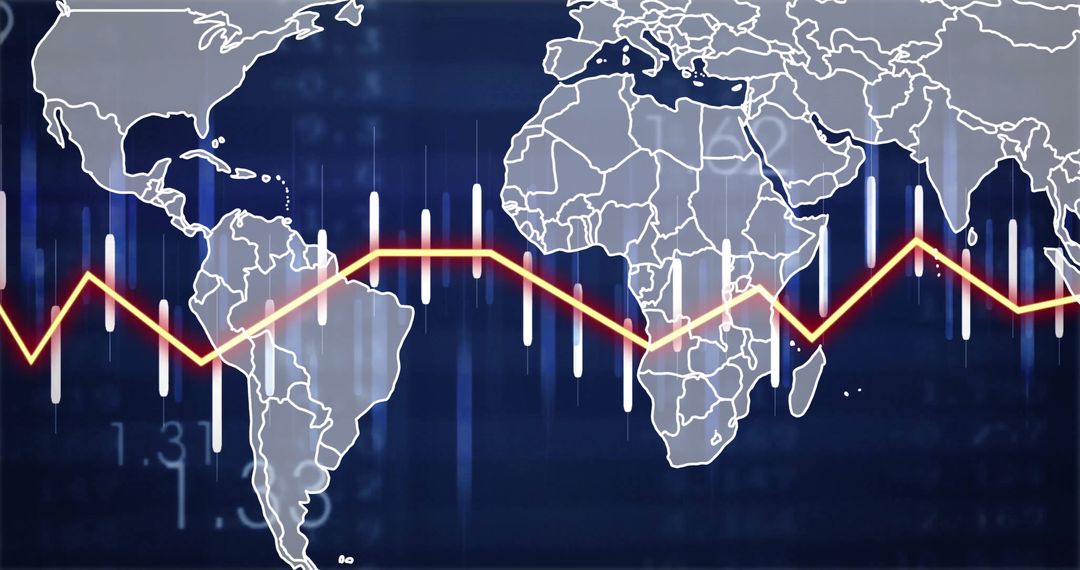
- Global Financial Trends Overlaid with World Statistics and Graphs
Global Financial Trends Overlaid with World Statistics and Graphs Image
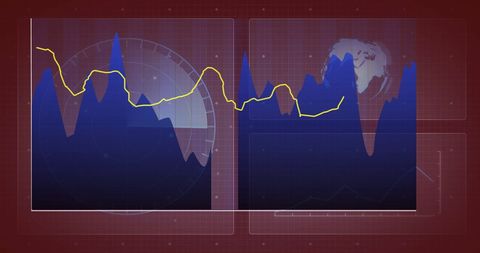
This image depicts financial data and global statistics merged with colorful charts on world map background. It is ideal for use in finance-related presentations, economic analyses, articles on market trends, corporate reports, or workflow visuals in analytics and business journalism.
Powered by 


2
downloads
downloads
Tags:
More
Credit Photo
If you would like to credit the Photo, here are some ways you can do so
Text Link
photo Link
<span class="text-link">
<span>
<a target="_blank" href=https://pikwizard.com/photo/global-financial-trends-overlaid-with-world-statistics-and-graphs/63c7c28a2c1ab9ee5b166786c8cd6d5a/>PikWizard</a>
</span>
</span>
<span class="image-link">
<span
style="margin: 0 0 20px 0; display: inline-block; vertical-align: middle; width: 100%;"
>
<a
target="_blank"
href="https://pikwizard.com/photo/global-financial-trends-overlaid-with-world-statistics-and-graphs/63c7c28a2c1ab9ee5b166786c8cd6d5a/"
style="text-decoration: none; font-size: 10px; margin: 0;"
>
<img src="https://pikwizard.com/pw/medium/63c7c28a2c1ab9ee5b166786c8cd6d5a.jpg" style="margin: 0; width: 100%;" alt="" />
<p style="font-size: 12px; margin: 0;">PikWizard</p>
</a>
</span>
</span>
Free (free of charge)
Free for personal and commercial use.
Author: Awesome Content
Similar Free Stock Images

Premium


Premium


Premium


Premium


Premium


Premium


Premium


Premium


Premium


Premium


Premium


Premium


Premium


Premium


Premium


Premium


Premium


Premium


Premium


Premium


Premium


Premium


Premium


Premium

