
- Home >
- Stock Photos >
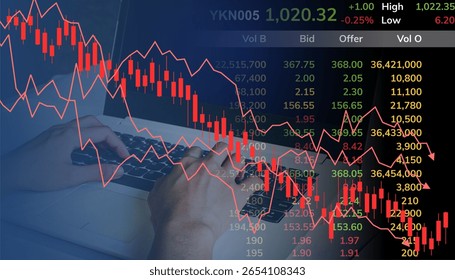
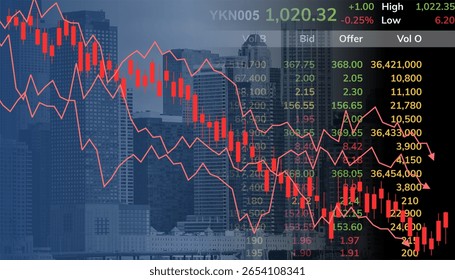
- Global Market Downtrend with Red Graph Line Illustration
Global Market Downtrend with Red Graph Line Illustration Image

The image shows a red line graph declining over a digital grid, representing a downward financial trend. Useful for illustrating market downturns, economic challenges, or discussions about investment risks. Ideal for financial reports, blogs about market analysis, economic presentations, and educational materials about global finance.
Powered by  - Get 15% off with code: PIKWIZARD15


downloads
Tags:
More
Credit Photo
If you would like to credit the Photo, here are some ways you can do so
Text Link
photo Link
<span class="text-link">
<span>
<a target="_blank" href=https://pikwizard.com/photo/global-market-downtrend-with-red-graph-line-illustration/6357a5e5c28bf400cab70c832166f65a/>PikWizard</a>
</span>
</span>
<span class="image-link">
<span
style="margin: 0 0 20px 0; display: inline-block; vertical-align: middle; width: 100%;"
>
<a
target="_blank"
href="https://pikwizard.com/photo/global-market-downtrend-with-red-graph-line-illustration/6357a5e5c28bf400cab70c832166f65a/"
style="text-decoration: none; font-size: 10px; margin: 0;"
>
<img src="https://pikwizard.com/pw/medium/6357a5e5c28bf400cab70c832166f65a.jpg" style="margin: 0; width: 100%;" alt="" />
<p style="font-size: 12px; margin: 0;">PikWizard</p>
</a>
</span>
</span>
Free (free of charge)
Free for personal and commercial use.
Author: Creative Art
Similar Free Stock Images
Loading...

Premium


Premium


Premium


Premium


Premium


Premium


Premium
Premium


Premium


Premium


Premium


Premium

Premium


Premium


Premium


Premium
Premium


Premium


Premium

Premium


Premium

Premium
Premium


Premium

Premium
