1. Home > 
  2. Stock Photos > 
  3. Glowing candlestick chart over perforated metal with neon trend line and teal bars

Glowing candlestick chart over perforated metal with neon trend line and teal bars Image

Glowing candlestick chart over perforated metal with neon trend line and teal bars

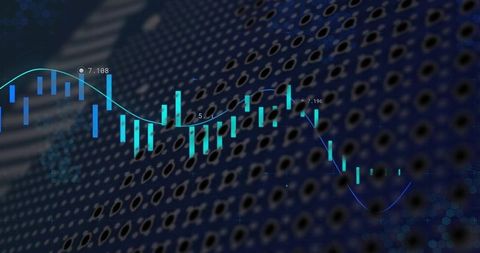
Displaying candlestick chart with teal bars and cyan trend line layered over perforated panel backdrop, creating depth and neon glow. Featuring value labels and soft bokeh elements for technical data emphasis and visual rhythm. Providing versatile visual for fintech landing pages, trading dashboards, investor reports, market analysis blogs, social media ads, pitch decks and presentation slides. Working well as header banner, hero background, app UI mockup or webinar thumbnail where overlaying text, logos or KPI numbers is required. Conveying modern, high-tech mood suitable for stories about market movement, algorithmic trading, data analytics and financial technology.

Powered by Shutterstock logo - Get 15% off with code: PIKWIZARD15
Stock market or forex trading graph in futuristic concept suitable for financial investment or Economic trends business idea and all art work design. Abstract finance background - Powered by Shutterstock - Get 15% off with code: PIKWIZARD15Financial technology and investment capital gain analytics with data of digital finance, stock market trends, fintech growth, and business performance using smart financial tools. - Powered by Shutterstock - Get 15% off with code: PIKWIZARD15Financial advisor explaining invest stock market data consulting investor. Two busy business men analysts doing finance trading analysis pointing at exchange chart on laptop screen working in office. - Powered by Shutterstock - Get 15% off with code: PIKWIZARD15Stock graph and financial chart. Analyze stock market finance volume of stock market with Graph and chart holograph technology. High quality photo - Powered by Shutterstock - Get 15% off with code: PIKWIZARD15Financial Expert Reviews Market Projections and Investment Strategies on Computer - Powered by Shutterstock - Get 15% off with code: PIKWIZARD15

Credit Photo

If you would like to credit the Photo, here are some ways you can do so

Free (free of charge)

Free for personal and commercial use.

Author: Authentic Images

Similar Free Stock Images

Colorful Financial Graph with Global Map Display
Premium
Two diverse crypto traders brokers stock exchange market investors discussing trading charts research reports growth using pc computer looking at screen analyzing invest strategy, financial risks.
Dynamic Global Financial Data Representation
Digital Financial Data Representation with Abstract Graph
Abstract Financial Data Technology Background
Digital Financial Data Display with Graphs and Metrics
Premium
Businessman drawing virtual technical graph and chart for analysis stock market, technology investment and value investment concept.
Data Processing Visualization with Cityscape Background
Futuristic Data Analysis with Chart and Digital Graphics
Abstract Financial Data with Neon Line Graph and Candlestick Chart
Digital Data Analysis Abstract Background with Graphs
Premium
Male trader sits at desk hold smart phone with stock market data, using laptop display graph and chart, analyzing investment, check trading stocks information, view over shoulder. Growth, profit, apps
Abstract Digital Market Analysis with Financial Charts
Digital Financial Data Technicolor Motion Chart
Financial Data Over Cityscape with Glowing Graph Lines
Global Business Dashboard Overlay on Urban Skyline Background
Premium
Real estate, development and investing concept with financial chart indicators and stock market graphs on city skyscrapers tops bottom view, double exposure
Global Financial Data Overlay on Digital World Map
Abstract Financial Data Concepts over Cityscape
Abstract Financial Graphs with Candlestick Chart Indicators
DNA Strand With Binary Code on Colorful Digital Background
Premium
Stock market financial investment and trading graph interface showing ticker price evolution with candlestick chart and moving average curves. Increasing profit. Forex. Person touching virtual screen.
Binary Code with Fluctuating Graph Over Dark Background
Financial Data Analysis with Graphs on Grey Background
Digital Financial Chart with Purple and Aqua Candlestick Bars
Futuristic Data Visualization on Global Map Interface
Premium
Double exposure of abstract financial graph with world map on office buildings background, forex and investment concept
Futuristic DNA Helix with Data Points and HUD Interface
Digital Analytics Display with Candlestick Graph and User Engagement
Displaying Neon Candlestick Chart with Gradient Trend Line, Markers and Particle Cloud
Showing Neon Candlestick Market Chart with Flowing Trend Line and Glowing Hexagon Grid
Premium
Business man holding tablet and showing holographic graphs and stock market statistics gain profits. Concept of growth planning and business strategy. Display of good economy form digital screen.
Dynamic Stock Market Analysis Concept Chart
Digital Financial Data Analysis with Chart and Markers
Premium
Business finance and investment, Analyze economic growth charts for informed business finance decisions and financial decision-making. Stock Market report, Strategy, Data Collection, Forecasting
Digital Financial Graph and Data Display on Blue Background
Digital Charts and Financial Data Background in Blue Tones
Data Visualization on Digital Screen in Modern Business
Futuristic Data Connections and Digital Network Interface
Premium
Investors analyze the data stock market index via smartphone screen to trade the stock chart for planning investments take profit, trade stock exchange market and cryptocurrency data, financial.
Cityscape with Digital Data Overlay: Urban Financial Analytics
Futuristic Data Analytics with Graphs and Charts
DNA Strand with Data Processing Interface Overlay
Global Business Data Analytics on World Map
Premium
Stock market analysis, business, finance and investment. Finance analyst analyzing stock market trading graph, economic growth chart, planning and strategy, business investment with financial report.
Digital Financial Graph and City Silhouette Backdrop
Financial Data Analytics Over Urban Skyline Backdrop
Digital Financial Data Over Cityscape Representation
Futuristic Financial Data and Analytics Pathway
Premium
Asian businessman checking stock market data, Stock market application for iPad, Analyzing stock market data on desktop, Young businessman with stock market chart background
City Skyline with Digital Graph Representing Market Trends
Digital Financial Data Processing on Circuit Board
Stock Market Graphs Displaying Financial Analytics
Digital Coding and Financial Stock Market Graph Analysis
Premium
planning and strategy, Stock market, Business growth, progress or success concept. Businessman or trader is showing a growing virtual hologram stock, invest in trading.
Dynamic Financial Data Analysis on Dark Background
Digital Stock Market Chart with Candlesticks and Line Graph
Dynamic Data Visualization with Bar Charts and Line Graphs in Digital Interface
Candlestick Chart with Moving Average for Data Analytics
Premium
Business analyze buy or sell economic growth charts for business finance decisions and financial decision-making. Stock Market report, Business finance and investment, Strategy, Forecasting.
Futuristic Digital Network Woven White Dotted Sine Waves
Neon Candlestick Chart Visualizing Market Trend on Digital Finance Dashboard with Icons
Neon Candlestick Chart Featuring Moving Averages, Segmented Trendline and Delta Labels on Trading UI
Financial Analysis with Digital Data and Vibrant Graph
Digital Financial Data with Illuminated Market Trend Line
Digital Financial Data Analysis with Graphs
Premium
Stock market analysis, business, finance and investment. Finance analyst analyzing stock market trading graph, economic growth chart, planning and strategy, business investment with financial report
Dynamic Financial Data Analytics Interface with Blue Background
Vibrant LED Wavy Dot Design with Dance Text
Digital Analytics Over Cityscape at Night
Finance Data Learning: Economic Trends and Market Analysis
Premium
A magnifying glass over a financial chart, illustrating market analysis and business concepts, in blue light against a dark background.
Analyzing Data Trends with Futuristic Graph Interface
Dynamic Digital Graph Overlay on World Map Illustrating Global Market Trends
Dynamic Financial Chart with Blue and Purple Indicators
Stagflation Concept with Digital Graphs and Data Patterns
Premium
Trader analyzing data on virtual screen.Price graph and indicator. Stock market invest and crypto currency. Stock market and business investment.
Visualizing Financial Data Trends Over Urban Backdrop
Abstract Financial Graph with Data Points over Digital Background
Digital Finance Analytics and Technological Data Visualization
Futuristic Audio Wave Visual with Neon Light Sparkles
Premium
Stock market graph trading analysis investment financial, stock exchange financial or forex graph stock market graph chart business crisis crash loss and grow up gain and profits win up trend
Digital Financial Data Visualization over Circuit Board
Abstract Financial Chart Representing Market Data Trends
Dynamic Data Graphs Display on Dark Digital Background
Purple Graphic Representation of Data Processing and Analysis
Premium
Stock trading market service concept. Business finance investment growth. Forex trader stock market safety security risk screen. Data protection broker account currency exchange economy technology
Financial Trading Chart Overlaying World Map with Red Trend Line
Digital Dashboard With Candlestick Bar and Line Graph Interface
Futuristic Financial Graph with Candlesticks and Wave Line
Futuristic 3D Financial Data Visualization Abstract
Premium
Financial Analysts and Day Traders Working on a Computers with Multi-Monitor Workstations with Real-Time Stocks, Commodities and Exchange Market Charts. Team of Brokers at Work in Agency.
Holographic Market Chart Showing Neon Candlestick Bars and Glowing Trend Line
Futuristic Data Dashboard Displaying Neon Waveform, Candlestick Charts and Concentric HUD
Dynamic Financial Data Visualization with Blue Trends
Data Visualization with Abstract Digital Graphs and Croses
Futuristic Global Financial Data Analysis Background
Digital Stock Market Pulse with Numbers on Blue Background
Premium
chart trading - stock exchange - economy
Digital Healthcare Data Visualization with Virus Cells During Pandemic
Digital Financial Chart Over Cityscape Backdrop
Digital Financial Data Processing Over Cityscape Background
Digital Globe with Data Analytics Interface Background
Premium
Stock market graph trading analysis investment financial, stock exchange financial or forex graph stock market graph chart business crisis crash loss and grow up gain and profits win up trend.
Abstract Purple Wave Pattern Over Digital Stock Market Display
Data Analysis and Graphs Displaying Stock Market Trends
Digital Data Processing Background with Dynamic Lines
Abstract Financial Data Chart Over Urban Skyline
Premium
Multi exposure of virtual abstract financial graph interface on blurry contemporary office building background, financial and trading concept
Financial Data Processing Over Digital Cityscape
Digital Data Chart on Grey Background with Red Trend Line
Colorful Graphical Data Analysis in Abstract Background
Dynamic Data Graph Overlay with Illuminated City Skyline
Premium
Analysis finance grow graph and market  investment. Financial  business plan,earnings,sale and strategy. Stock market chart, exchange financial growth diagram.
Colorful Digital Bar Graph Data Analysis Concept
Digital Visualization of DNA Strand and Data Processing Overlay
Futuristic Financial Chart Data Analysis with Blue Bar Graph
Global Data Visualization on Digital Interface Background
Premium
Technical price graph and indicator, red and green candlestick chart on blue theme screen, market volatility, up and down trend. Stock trading, crypto currency background.
Futuristic Data Visualization with Highlighted Analytics Trends
Neon Digital Data Dashboard with Interactive Analytics Interface
Futuristic Neon Financial Chart with Candlestick Indicators
Neon Market Trend Dashboard with Cyan Candlesticks and Smooth Blue Trend Line on Dark Grid
Premium
Stock market or forex trading graph and candlestick chart suitable for financial investment concept. Economy trends background for business idea and all art work design. Abstract finance background
Displaying Neon Candlestick Chart with Curved Trend Line, Data Markers and Hex Grid