- Home >
- Stock Photos >
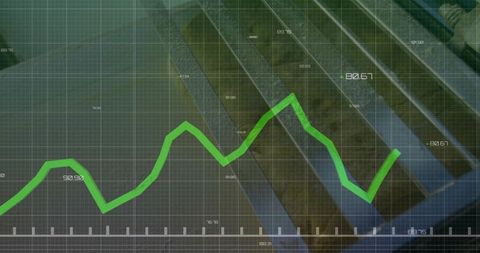
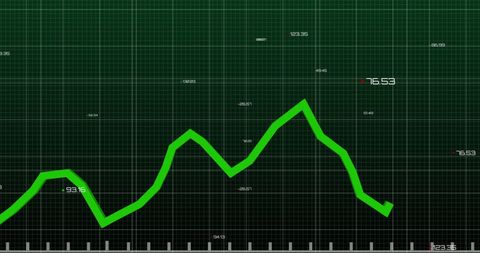
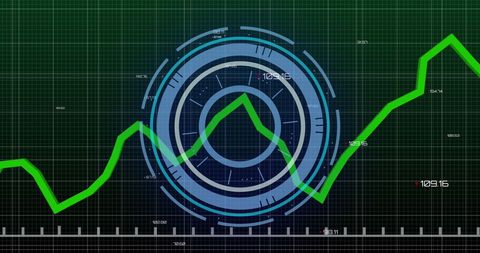
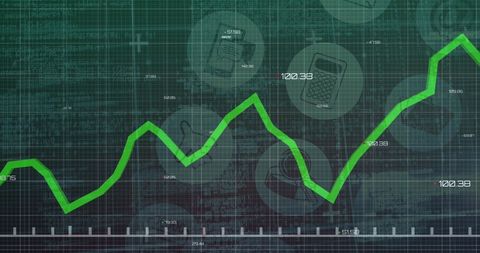
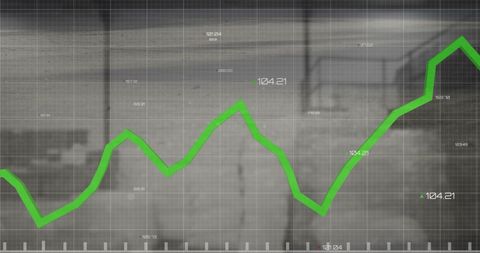
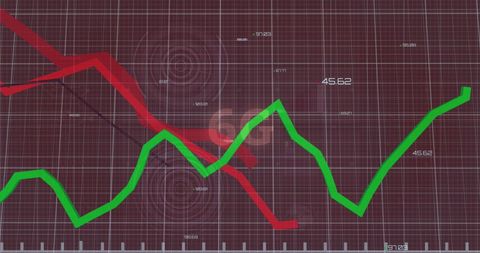
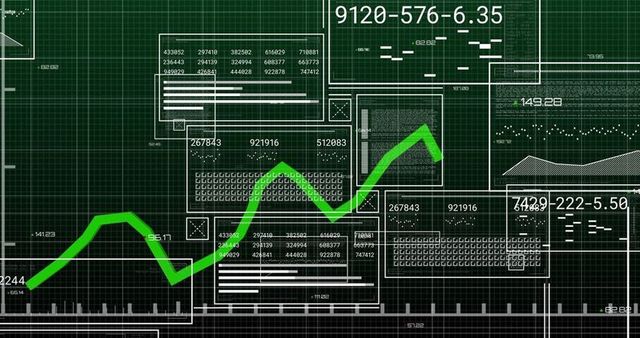
- Green Analytics Line Graph on Dark Grid Background
Green Analytics Line Graph on Dark Grid Background Image
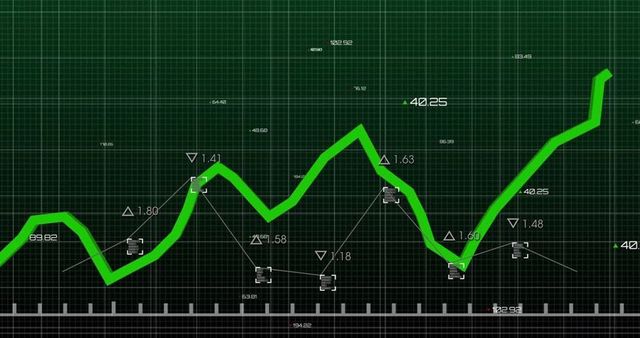
Display features a dynamic green line chart over a dark grid, representing analytics and statistical data. Overlay with numeric indicators illustrates change in values, ideal for use in finance and tech presentation slides, illustrating market trends and business forecasting.

downloads
Tags:
More
Credit Photo
If you would like to credit the Photo, here are some ways you can do so
Text Link
photo Link
<span class="text-link">
<span>
<a target="_blank" href=https://pikwizard.com/photo/green-analytics-line-graph-on-dark-grid-background/13e6d92f4881b753d4a9e15569589e95/>PikWizard</a>
</span>
</span>
<span class="image-link">
<span
style="margin: 0 0 20px 0; display: inline-block; vertical-align: middle; width: 100%;"
>
<a
target="_blank"
href="https://pikwizard.com/photo/green-analytics-line-graph-on-dark-grid-background/13e6d92f4881b753d4a9e15569589e95/"
style="text-decoration: none; font-size: 10px; margin: 0;"
>
<img src="https://pikwizard.com/pw/medium/13e6d92f4881b753d4a9e15569589e95.jpg" style="margin: 0; width: 100%;" alt="" />
<p style="font-size: 12px; margin: 0;">PikWizard</p>
</a>
</span>
</span>
Free (free of charge)
Free for personal and commercial use.
Author: People Creations