- Home >
- Stock Photos >
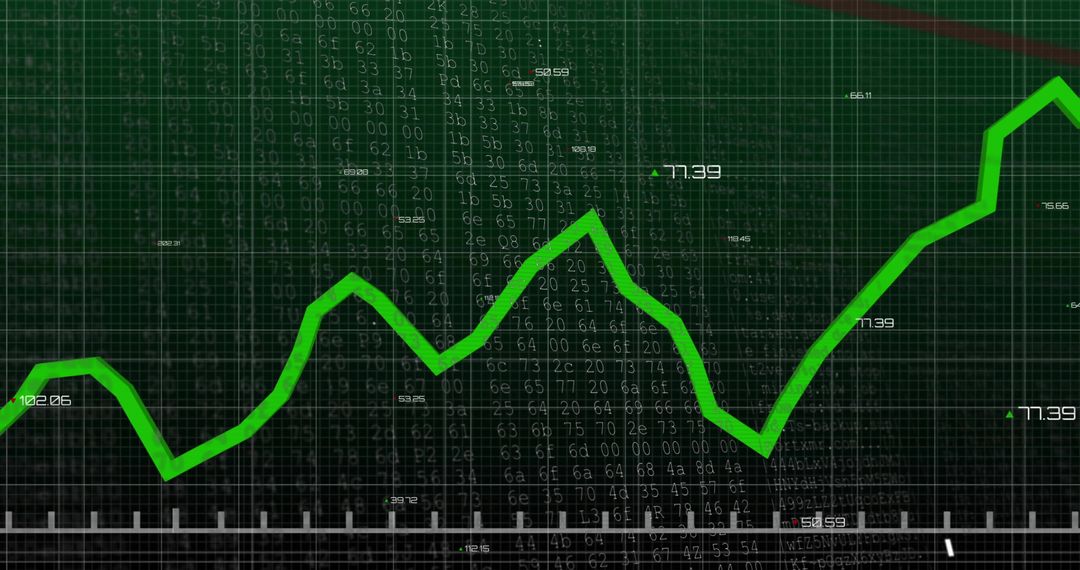
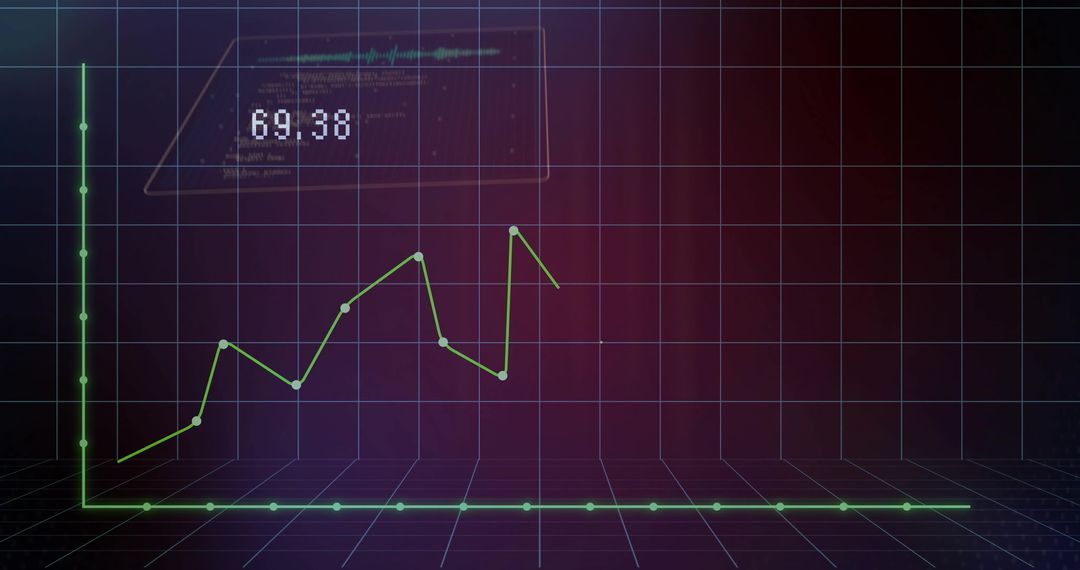
- Green Data Line Sweeping Across Futuristic Dashboard Grid Showing Analytics Trend and Telemetry
Green Data Line Sweeping Across Futuristic Dashboard Grid Showing Analytics Trend and Telemetry Image

Bright green line chart sweeping across dark grid dashboard with numeric labels and translucent floating icons. Futuristic neon glow conveying upward momentum, real-time telemetry, and data analytics. Clean composition offering strong focal line and ample negative space for overlaying headlines, logos, or charts. Ideal for illustrating market growth, performance monitoring, business intelligence, fintech concepts, UI/UX design, and technology presentations. Recommended uses include website hero banners, pitch deck covers, report covers, social media ads, editorial illustrations, and broadcast graphics. Allowing easy customizing of colors and adding annotations for branded visualizations and data storytelling.
Powered by  - Get 15% off with code: PIKWIZARD15


0
downloads
downloads
Tags:
More
Credit Photo
If you would like to credit the Photo, here are some ways you can do so
Text Link
photo Link
<span class="text-link">
<span>
<a target="_blank" href=https://pikwizard.com/photo/green-data-line-sweeping-across-futuristic-dashboard-grid-showing-analytics-trend-and-telemetry/f773d6d98cc1fd7ff118bf71bc98c709/>PikWizard</a>
</span>
</span>
<span class="image-link">
<span
style="margin: 0 0 20px 0; display: inline-block; vertical-align: middle; width: 100%;"
>
<a
target="_blank"
href="https://pikwizard.com/photo/green-data-line-sweeping-across-futuristic-dashboard-grid-showing-analytics-trend-and-telemetry/f773d6d98cc1fd7ff118bf71bc98c709/"
style="text-decoration: none; font-size: 10px; margin: 0;"
>
<img src="https://pikwizard.com/pw/medium/f773d6d98cc1fd7ff118bf71bc98c709.jpg" style="margin: 0; width: 100%;" alt="" />
<p style="font-size: 12px; margin: 0;">PikWizard</p>
</a>
</span>
</span>
Free (free of charge)
Free for personal and commercial use.
Author: Authentic Images
Similar Free Stock Images

Premium


Premium


Premium


Premium


Premium


Premium


Premium


Premium


Premium


Premium


Premium


Premium


Premium


Premium


Premium


Premium


Premium


Premium


Premium


Premium


Premium


Premium


Premium


Premium