
- Home >
- Stock Photos >
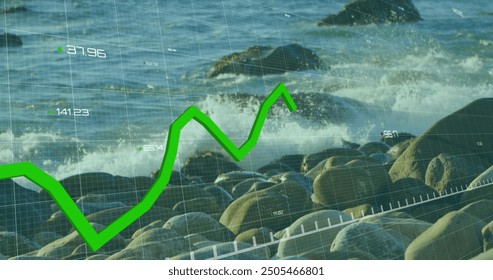
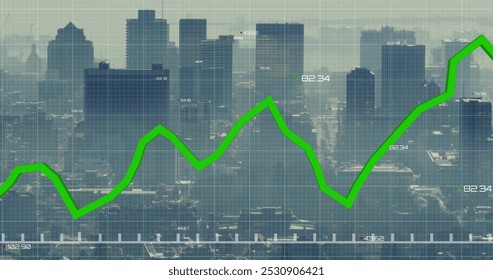
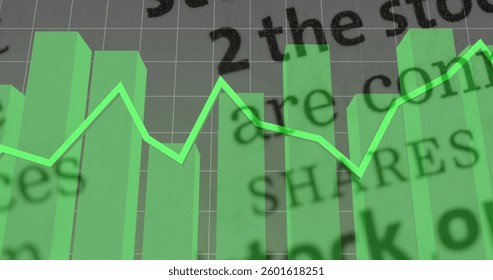
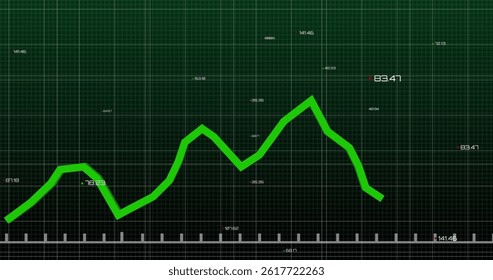
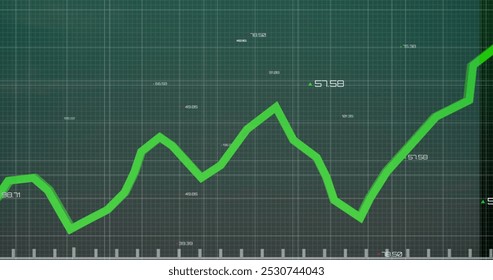
- Green Financial Line Graph with Candlestick Data on Grid Background
Green Financial Line Graph with Candlestick Data on Grid Background Image

Dynamic graph with candlestick patterns showing financial fluctuations and market indicators. Useful for presentations on economic growth, financial market analysis, business strategy insights, investment trends, or educational purposes regarding data analytics and stock performance.
Powered by  - Get 15% off with code: PIKWIZARD15


downloads
Tags:
More
Credit Photo
If you would like to credit the Photo, here are some ways you can do so
Text Link
photo Link
<span class="text-link">
<span>
<a target="_blank" href=https://pikwizard.com/photo/green-financial-line-graph-with-candlestick-data-on-grid-background/cdd303daecfaf88fa27f9a8d77f1a8bf/>PikWizard</a>
</span>
</span>
<span class="image-link">
<span
style="margin: 0 0 20px 0; display: inline-block; vertical-align: middle; width: 100%;"
>
<a
target="_blank"
href="https://pikwizard.com/photo/green-financial-line-graph-with-candlestick-data-on-grid-background/cdd303daecfaf88fa27f9a8d77f1a8bf/"
style="text-decoration: none; font-size: 10px; margin: 0;"
>
<img src="https://pikwizard.com/pw/medium/cdd303daecfaf88fa27f9a8d77f1a8bf.jpg" style="margin: 0; width: 100%;" alt="" />
<p style="font-size: 12px; margin: 0;">PikWizard</p>
</a>
</span>
</span>
Free (free of charge)
Free for personal and commercial use.
Author: People Creations
Similar Free Stock Images

Premium


Premium


Premium


Premium


Premium


Premium

Premium

Premium

Premium


Premium


Premium


Premium


Premium


Premium


Premium


Premium


Premium

Premium


Premium


Premium
Premium


Premium


Premium


Premium

Premium


Explore More Free Stock Images