- Home >
- Stock Photos >
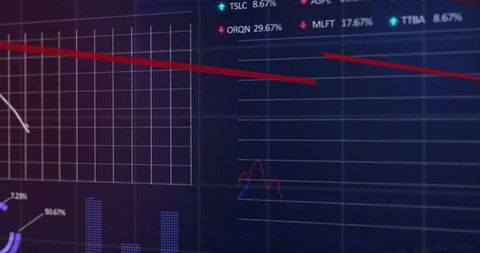
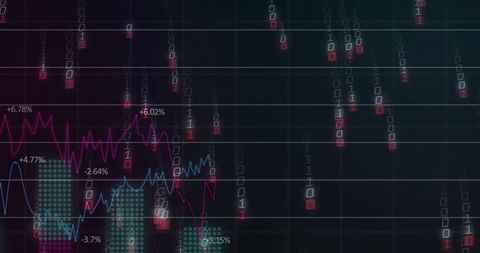
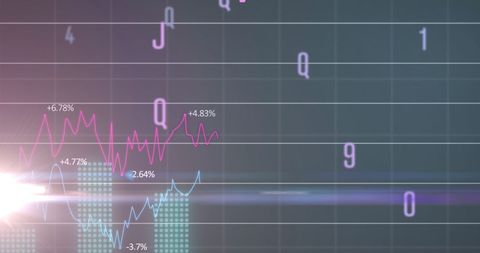
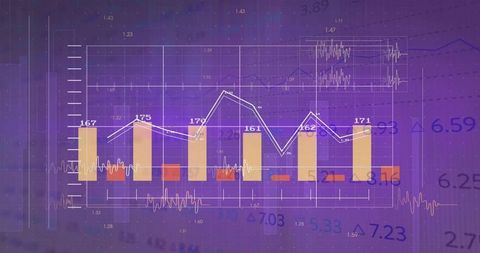
- Green Holographic Stock Market Data Visualization
Green Holographic Stock Market Data Visualization Image
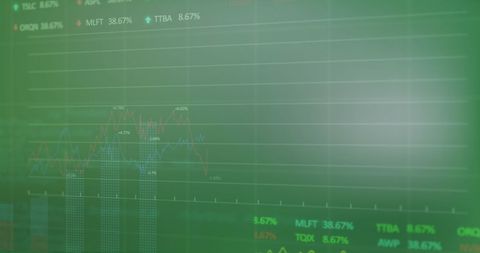
Presentation of holographic financial data comprising stock market graphs and trading details against a green background. Suitable for illustrating concepts related to business intelligence, financial reports, market analysis, and digital investment platforms.

downloads
Tags:
More
Credit Photo
If you would like to credit the Photo, here are some ways you can do so
Text Link
photo Link
<span class="text-link">
<span>
<a target="_blank" href=https://pikwizard.com/photo/green-holographic-stock-market-data-visualization/9c5c08ca9bb5e1ae1e02483df37a03e2/>PikWizard</a>
</span>
</span>
<span class="image-link">
<span
style="margin: 0 0 20px 0; display: inline-block; vertical-align: middle; width: 100%;"
>
<a
target="_blank"
href="https://pikwizard.com/photo/green-holographic-stock-market-data-visualization/9c5c08ca9bb5e1ae1e02483df37a03e2/"
style="text-decoration: none; font-size: 10px; margin: 0;"
>
<img src="https://pikwizard.com/pw/medium/9c5c08ca9bb5e1ae1e02483df37a03e2.jpg" style="margin: 0; width: 100%;" alt="" />
<p style="font-size: 12px; margin: 0;">PikWizard</p>
</a>
</span>
</span>
Free (free of charge)
Free for personal and commercial use.
Author: Creative Art