1. Home > 
  2. Stock Photos > 
  3. Green Line Chart on 3D Digital Graph for Financial Analysis

Green Line Chart on 3D Digital Graph for Financial Analysis Image

Green Line Chart on 3D Digital Graph for Financial Analysis

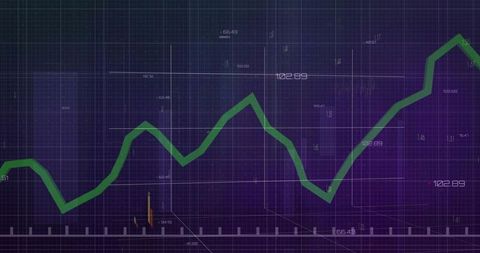
Visualization includes fluctuating green line chart representing market trends, numerics enhancing overall financial analytics theme. Useful for financial webinars, presentations, investment tutorials, hacking financial data strategies, and showcasing analytics tools.

Powered by Shutterstock logo - Get 15% off with code: PIKWIZARD15
Financial Expert Reviews Market Projections and Investment Strategies on Computer - Powered by Shutterstock - Get 15% off with code: PIKWIZARD15Abstract glowing big data forex candlestick chart on blurry city backdrop. Trade, technology, investment and analysis concept. Double exposure - Powered by Shutterstock - Get 15% off with code: PIKWIZARD15Analysis finance grow graph and market  investment. Financial  business plan,earnings,sale and strategy. Stock market chart, exchange financial growth diagram. - Powered by Shutterstock - Get 15% off with code: PIKWIZARD15Close up back view of businessman work on computer and cellphone consider financial diagrams graphs. Male CEO or employee analyze finances statistics on laptop and smartphone. Banking concept. - Powered by Shutterstock - Get 15% off with code: PIKWIZARD15Business woman sitting front laptop computer with financial graphs and statistics on monitor. Double exposure. Wide - Powered by Shutterstock - Get 15% off with code: PIKWIZARD15

Credit Photo

If you would like to credit the Photo, here are some ways you can do so

Free (free of charge)

Free for personal and commercial use.

Author: Authentic Images

Similar Free Stock Images

Data Analysis Process with Green Digital Interface
Premium
Businessman analyzes profitability of working companies with digital augmented reality graphics, positive indicators in 2024, businessman calculates financial data for long-term investments.
Digital Interface Showing Global Business Data Analytics
Fluctuating Digital Stock Market Data Chart
Digital Data Analysis with Green Line Graph on Grid Background
Financial Data Line Graph on Digital Display
Premium
Stockmarket online trading chart candlestick on crypto currency platform. Stock exchange financial market price candles graph data pattern analysis concept. Computer screen closeup background
Digital Financial Data and Global Market Analysis on Graph
Dynamic Forex Trading Graphs with Increasing Numbers
Rising Graph Line on Digital Green Grid Background
Green Data Graph on Black Digital Interface
Premium
Stock market or forex trading graph in futuristic concept suitable for financial investment or Economic trends business idea and all art work design. Abstract finance background
Data Analysis Graphics on Digital Grid Background
NFT Financial Data Visualization with Digital Graph Overlay
Digital Stock Market Graph with Abstract Coding Background
Green Line Graph with Data Points on Grid Background
Premium
Business strategy development and growing growth plan.	
Financial management strategy for business growth.Graph and chart. Investment of growth on currency rate.
Abstract Financial Data Processing and Analysis Interface
Financial Graph with Data Analysis and Market Statistics
Financial Growth Stock Nikkei in Urban City Skyline
Digital Stock Market Graph Red Trendline on Green Background
Premium
African American woman using virtual dashboard to predict emerging market trends in financial analytics for her business.
Futuristic Data Visualization with Dynamic Graphs and Digital Globe
Futuristic Neon Green Data Visualization on Grid Background
Red Line Graph Displaying Complex Digital Trend Analysis
Futuristic Financial Data Analytics with Particle Visualization
Premium
Business people analyze financial data chart trading forex, investing in stock markets, funds and digital assets, Business finance technology and investment concept, Business finance background.
Dynamic Green Data Chart on Futuristic Digital Interface Background
Red Downtrend Line Falling Across Digital Financial Dashboard With Teal Indicator Dots
Dotted DNA helix weaving through biotech analytics dashboard with colorful data graphs
Futuristic data waveform tracking green trend line across blue helix analytics grid
Digital Currency Trading Interface with Data Visualization
Global Economic Trends Highlighted on World Map with Graphs
Premium
Finance analyst working on business analytics and data management system to make financial report with business performance, KPI dashboard. Corporate strategy for finance, digital marketing plan
Innovative Data Analysis with Dynamic Line Graph and Digital Elements
Digital Financial Data Analysis with Growth Chart
Dynamic Stock Market Graph Displaying Surging Growth
Cryptocurrency Growth Chart Over Digital World Map
Premium
Stock market or forex trading graph on touchscreen,  finance and investment concept. Economy trends for business, financial charts and digits.
Digital Data Visualization with Trend Lines and Percentage Changes
Rising Financial Data Graph on Digital Grid Background
Digital Data Processing Interface with Green Growth Chart
Dynamic Green Line Graph Depicting Financial Data
Premium
Businessman using pen touch candle chart financial growth of business and world economy. Stock market price increase. Stock market investment analysis, financial risk management and investment.
Dynamic Financial Graphs Overlaying Modern Cityscape
Green Line Graph Overlapping Data Server Racks in Technology Center
Green Graph Showing Forex Trends on Transparent Cyber Interface
Dynamic Financial Data Overlaid on Grid Background
Premium
Businessman analyzes profitability of working companies with digital augmented reality graphics, positive indicators in 2023, businessman calculates financial data for long-term investments.
Dynamic Financial Data Chart Showing Trend Analysis
Dynamic Stock Market Analysis with Digital Graph Lines
Digital Green Line Graph Over Grid with Statistics and Numbers
Dynamic Line Graph Displaying Data Trends on Beige Grid Background
Premium
Analysis finance grow graph and market investment. Financial business plan,earnings,sale and strategy. Stock market chart, exchange financial growth diagram.
Candlestick Chart Visualization with Indicators and Growth Highlight
Green Trend Line on Dark Grid Represents Economic Growth
Fluctuating Line Graph on Analytics Dashboard
Interactive Line Graph Dashboard with Coding Background
Premium
Analyst working with Business Analytics and Data Management System on computer to make report with KPI and metrics connected to database. Corporate strategy for finance, operations, sales, marketing
Green Data Line Sweeping Across Futuristic Dashboard Grid Showing Analytics Trend and Telemetry
Overlaying fingerprint analytics with rising green line chart on dark grid cyber dashboard
Candlestick trading chart displaying trend lines, indicators and percentage labels
Financial Graph and Cityscape Analysis with Technological Overlay
Financial Data Charts with World Map on Blue Digital Background
Digital Interface with Global Financial Graphs Background
Premium
Businessmen work with stock market investments using tablets to analyze trading data. smartphone with stock exchange graph on screen. Financial stock market.
Futuristic Graph and Data Visualization Interface Design
Financial Graph Analysis on Green Grid Background
Digital Finance Chart Overlaying Globe Background
Digital Lock with Real-Time Data Display
Premium
Man look at the dashboard with graphs and charts. Concept of data management system, business intelligence, data statistics, marketing analysis, key performance indicators (KPI) and analytics.
Dynamic Financial Data Visualization on Digital Grid Background
Dynamic Data Chart on Dark Digital Background
Binary Code and Financial Data on Digital Screen
Abstract Graphs Over Modern Building at Night
Premium
Stock market chart, exchange financial growth diagram.Analysis finance grow graph and market investment. Financial business plan,earnings,sale and strategy.
Dynamic Red Line Graph With Data Points on Gridded Background
Business Colleagues Analyzing Financial Graph in Office Meeting
Fluctuating Financial Graph on Green Grid Background
Analyzing Growing Graph Line on Purple Gradient Background
Premium
Man look at the dashboard with graphs and charts. Concept of data management system, business intelligence, data statistics, marketing analysis, key performance indicators (KPI) and analytics.
Digital Graphs and Data Visualization on Green Background
Digital Financial Chart with Green Trend Line on Grid Background
NFT Concept with Dynamic Line Graphs on Digital Grid Background
Rising Red Line Graph with Stock Market Candlesticks Overlay
Premium
Businessman working with data management system on computer to make report with KPI and metrics connected to database. finance, operations, sales, marketing, KPI, business performance indicators.
Green Fluctuating Line Graph on Digital Grid for Financial Analysis
Interactive Digital Infographic with Callouts and Graph Elements
Green Line Chart on Dark Grid Interface with Sine Wave Data
Financial Growth Illustrated with Bar Charts and Upward Arrow
Premium
Stock market graph trading analysis investment financial, stock exchange financial or forex graph stock market graph chart business crisis crash loss and grow up gain and profits win up trend.
Tracking rising market trend with bold green line on futuristic trading dashboard display
Thick red trend line declining across dashboard grid with green markers and labels
World Map with Falling Line Graphs Indicating Global Economic Decline
Digital Financial Data Display with Graph and Grid
Digital Finance: Modern Stock Market Analysis Display
Green Line Rising on Digital Trading Board with Abstract Background
Premium
hand show graph chart stock market economic. growth business concept. plan strategy company increase profit to success global. trend marketing grows technology digital. economy, financial, and invest
Dynamic Data Graphs on Digital Interface Background
Financial Graphs Displaying Business Trends on Grid Background
Business Women Analyzing Data in Office with Growth Chart Overlay
Abstract Digital Data with Upward Trending Line Graph
Premium
Stock market finance business, economy trend graph digital technology.
Financial Growth Chart with Dynamic Green Line on Grid Overlay
Binary Code Financial Analytics with Rising Graph Line
Dynamic Financial Chart with Red Line Graph on Digital Interface
Line Graph Illustrating Data Trend on Green Digital Background
Premium
Real estate, development and investing concept with financial chart indicators and stock market graphs on city skyscrapers tops bottom view, double exposure
Real-Time Financial Data Analysis with Graphs and Charts
Financial Data Visualization on World Map with Graph Analytics
Global Finance and Data Analytics in Server Environment
Green Line Graph on Dark Digital Grid
Premium
Strategizing Wealth Management: Close-up of Hands Holding Financial Data amidst Office Desktop Dynamics
Advanced Financial Charting with Zigzag Indicator and Trends
Advanced Digital Dashboard with Rising Bar and Line Charts
Red Zigzag Graph on Digital Analytics Dashboard Interface
Dynamic Line Chart Representing Financial Data Growth
Premium
Double exposure businessman and stock market or forex graph suitable for financial investment concept. Economy trends background for business idea and all art work design. Abstract finance background.
Red Line Chart Trending Downward in Data Visualization
Digital Financial Analytics with Red Trends on Grid Screen
Advanced Data Visualization on Finance Dashboard
Futuristic HUD Facial Recognition Avatar with Neon Waveform Analytics and Grid Interface
Premium
A magnifying glass over a financial chart, illustrating market analysis and business concepts, in blue light against a dark background.
Neon Social Media Analytics Line Chart with Engagement Bubbles Showing Likes Comments