
- Home >
- Stock Photos >
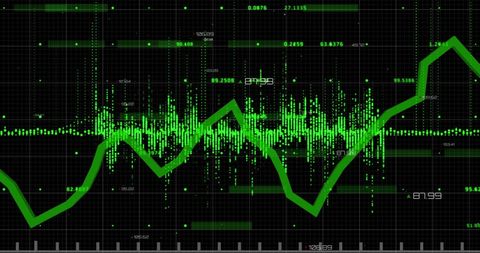
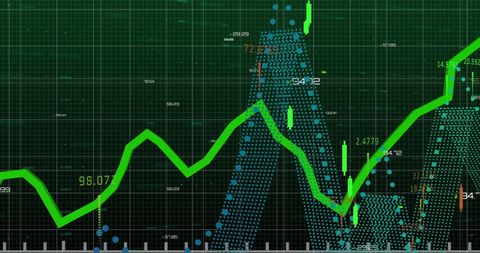
- Green Line Chart on Digital Interface with Data Display
Green Line Chart on Digital Interface with Data Display Image
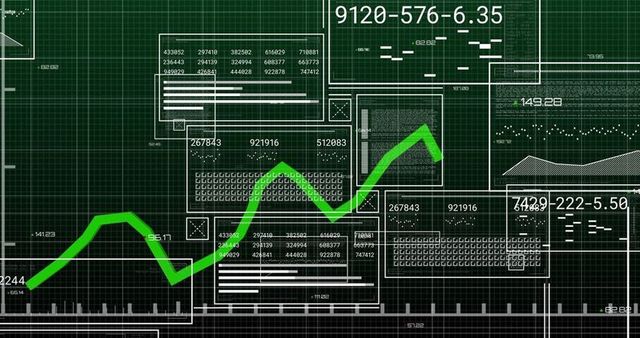
Green zigzag arrow indicates an upward trend traversing digital panels rich with numeric codes and graphs, symbolizing financial growth and data analysis. Utilize this for business presentations, financial reports and technology content illustrating performance improvement and futuristic interfaces.
Powered by 


downloads
Tags:
More
Credit Photo
If you would like to credit the Photo, here are some ways you can do so
Text Link
photo Link
<span class="text-link">
<span>
<a target="_blank" href=https://pikwizard.com/photo/green-line-chart-on-digital-interface-with-data-display/af7803b0b4394e70e24e1dbef68e451f/>PikWizard</a>
</span>
</span>
<span class="image-link">
<span
style="margin: 0 0 20px 0; display: inline-block; vertical-align: middle; width: 100%;"
>
<a
target="_blank"
href="https://pikwizard.com/photo/green-line-chart-on-digital-interface-with-data-display/af7803b0b4394e70e24e1dbef68e451f/"
style="text-decoration: none; font-size: 10px; margin: 0;"
>
<img src="https://pikwizard.com/pw/medium/af7803b0b4394e70e24e1dbef68e451f.jpg" style="margin: 0; width: 100%;" alt="" />
<p style="font-size: 12px; margin: 0;">PikWizard</p>
</a>
</span>
</span>
Free (free of charge)
Free for personal and commercial use.
Author: Creative Art
Similar Free Stock Images

Premium


Premium


Premium


Premium


Premium


Premium


Premium


Premium


Premium

Premium


Premium


Premium

Premium

Premium


Premium


Premium

Premium


Premium


Premium

Premium


Premium


Premium


Premium

Premium


Premium

Explore More Free Stock Images